Combining pre-market creative intelligence and in-market TV attention to drive better business outcomes
It’s simple. Ads work best when people pay attention. If audiences aren’t engaged, then advertisers are already starting from behind. It’s why marketers test creative before they launch campaigns – it helps to gauge the potential impact of their ad, and ensure they’re putting their best foot forward.
So what happens after pre-campaign testing? When the ad is live in real-world situations? Is there a difference between pre-campaign performance and in-market attention? And importantly, how can creative performance guide media placement, and flag signs of creative wearout?
To answer these questions, TVision & Realeyes took a look at the connection between creative and media in an innovative study designed to empower marketers to better understand how pre-market video creative intelligence can combine with in-market TV attention measurement to drive better business outcomes.
If audiences aren’t engaged, then advertisers are already starting from behind.
What You Need to Know
- There is a Correlation Between Pre-Campaign and In-Market Attention
- Not All Creative Benefits Equally from Premium Media Placements
While high-scoring creative performs well across most dayparts (even less expensive daytime hours), low-scoring creative has the best chance of success during premium dayparts. If pre-campaign testing reveals low-scoring creative, but marketers don’t have the luxury of editing or reinventing new creatives, they should consider weighting their media toward primetime dayparts to ensure their ad has the best opportunity to break through. - Low-Performing Creative Needs Repeat Exposures to “Wear In” and Show an Uplift in Impact
Attention scores for these ads can improve by as much as 5% as they are shown with increased frequency. If you’ve already invested in a low-scoring ad, don’t intentionally limit frequency. Instead, monitor in-market attention to give it time to wear in. - High-Performing Creative Will Wear Out More Quickly
The attention boost marketers get from creative that scores well in pre-campaign testing will fade as frequency is increased. This suggests that if marketers shouldn’t plan to rest for long on the laurels of great creative, and should check in on the performance of older ads if they’re scheduled to run within high-value media placements. - Ad Performance Varies Over Time and Across Media Placements
Metrics like the Realeyes Quality Score and TVision’s Creative Attention Score are guide posts, but ultimately creative performance is dependent on external factors. It is important to continually test and monitor ads to know the best placement strategies.
by Realeyes & TVision | Q4 2021
Specific Creative Elements Can Help Drive Attention & Engagement
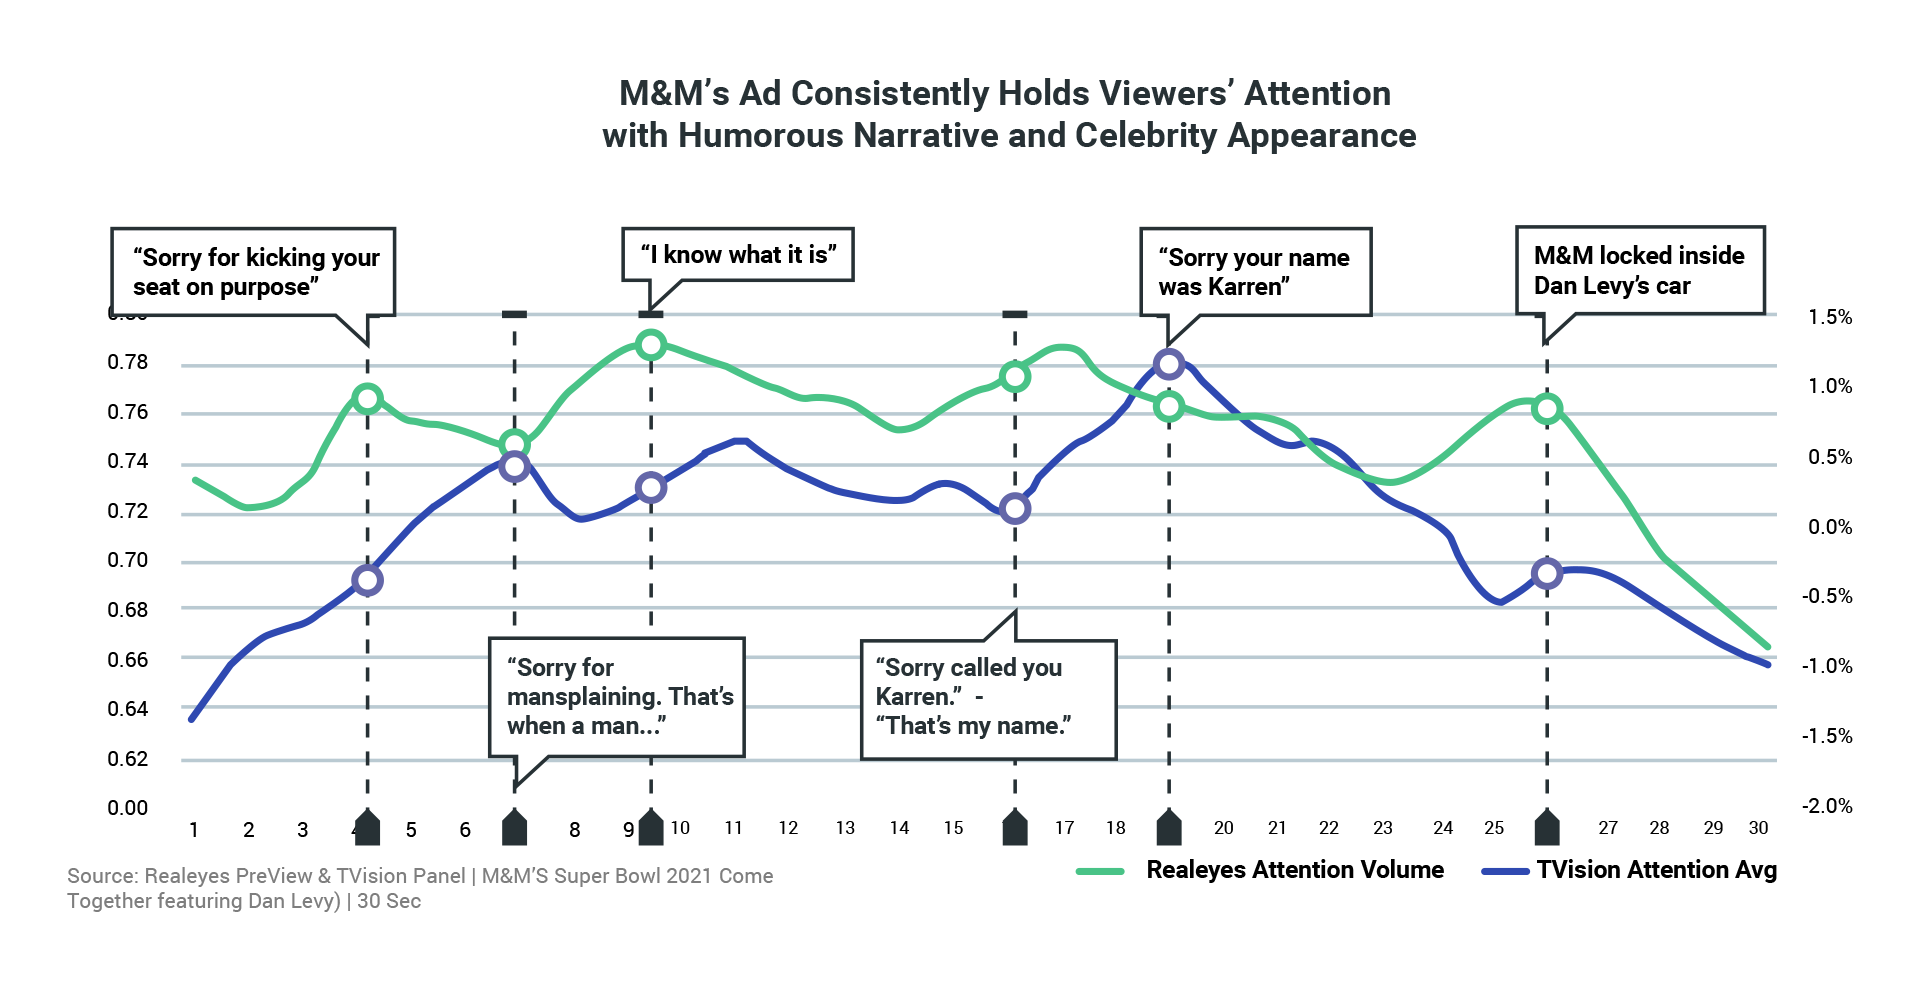
Realeyes and TVision’s second-by-second data tracks key moments where viewers pay the most attention. The analysis demonstrates how different creative elements (narrative, music, celebrity appearances, etc.) can help or hurt viewer attention. Ads from Microsoft and M&M’s provide good examples of how ad attention is impacted by specific elements.
The chart shows the change in creative attention compared to the M&M’s ad’s average. Realeyes’ pre-market attention volume curve tracks closely with TVision’s in-market attention curve. M&M’s, appealing narrative was effective at drawing audiences in after a slower start. At the :18 second mark, viewer attention spiked and then held when Dan Levy appeared on screen.
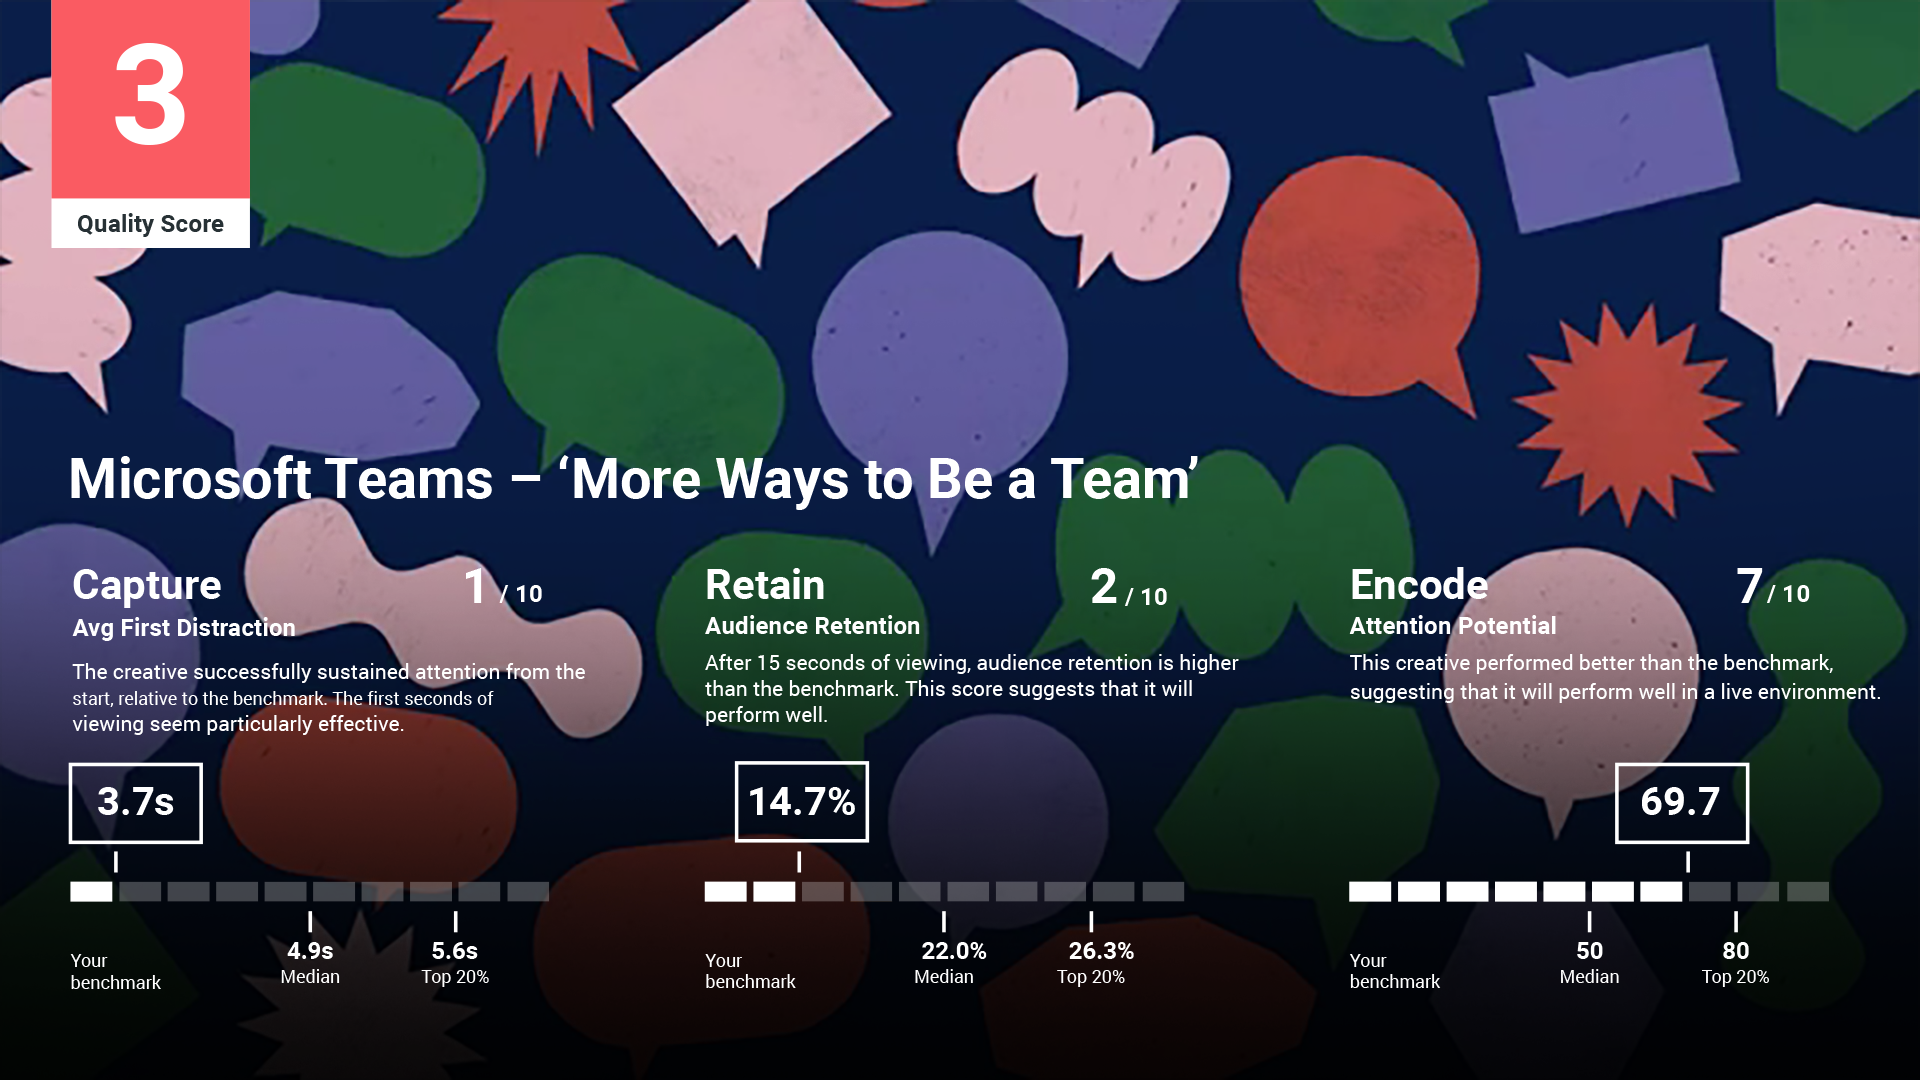

Microsoft Teams struggles to hold attention with continuous edits of abstract creative
In the case of the Microsoft Team ad, we see that creative techniques vary in their effectiveness at holding viewers’ attention. The ad started strong with catchy music, but started to lose viewers with abstract imagery. Familiar characters on-screen recaptured attention, as did the creative slogan at the end of the ad.
Maximizing Low-Performing Creative and Driving Efficiency of High-Performing Creative
In a perfect world, advertisers would only flight the highest quality advertising creatives, determined by pre-market scores like Realeyes’ or historical data about which creatives drove desired business results. However, advertisers often need to rely on a limited inventory of creatives of varying quality to achieve their campaign goals.
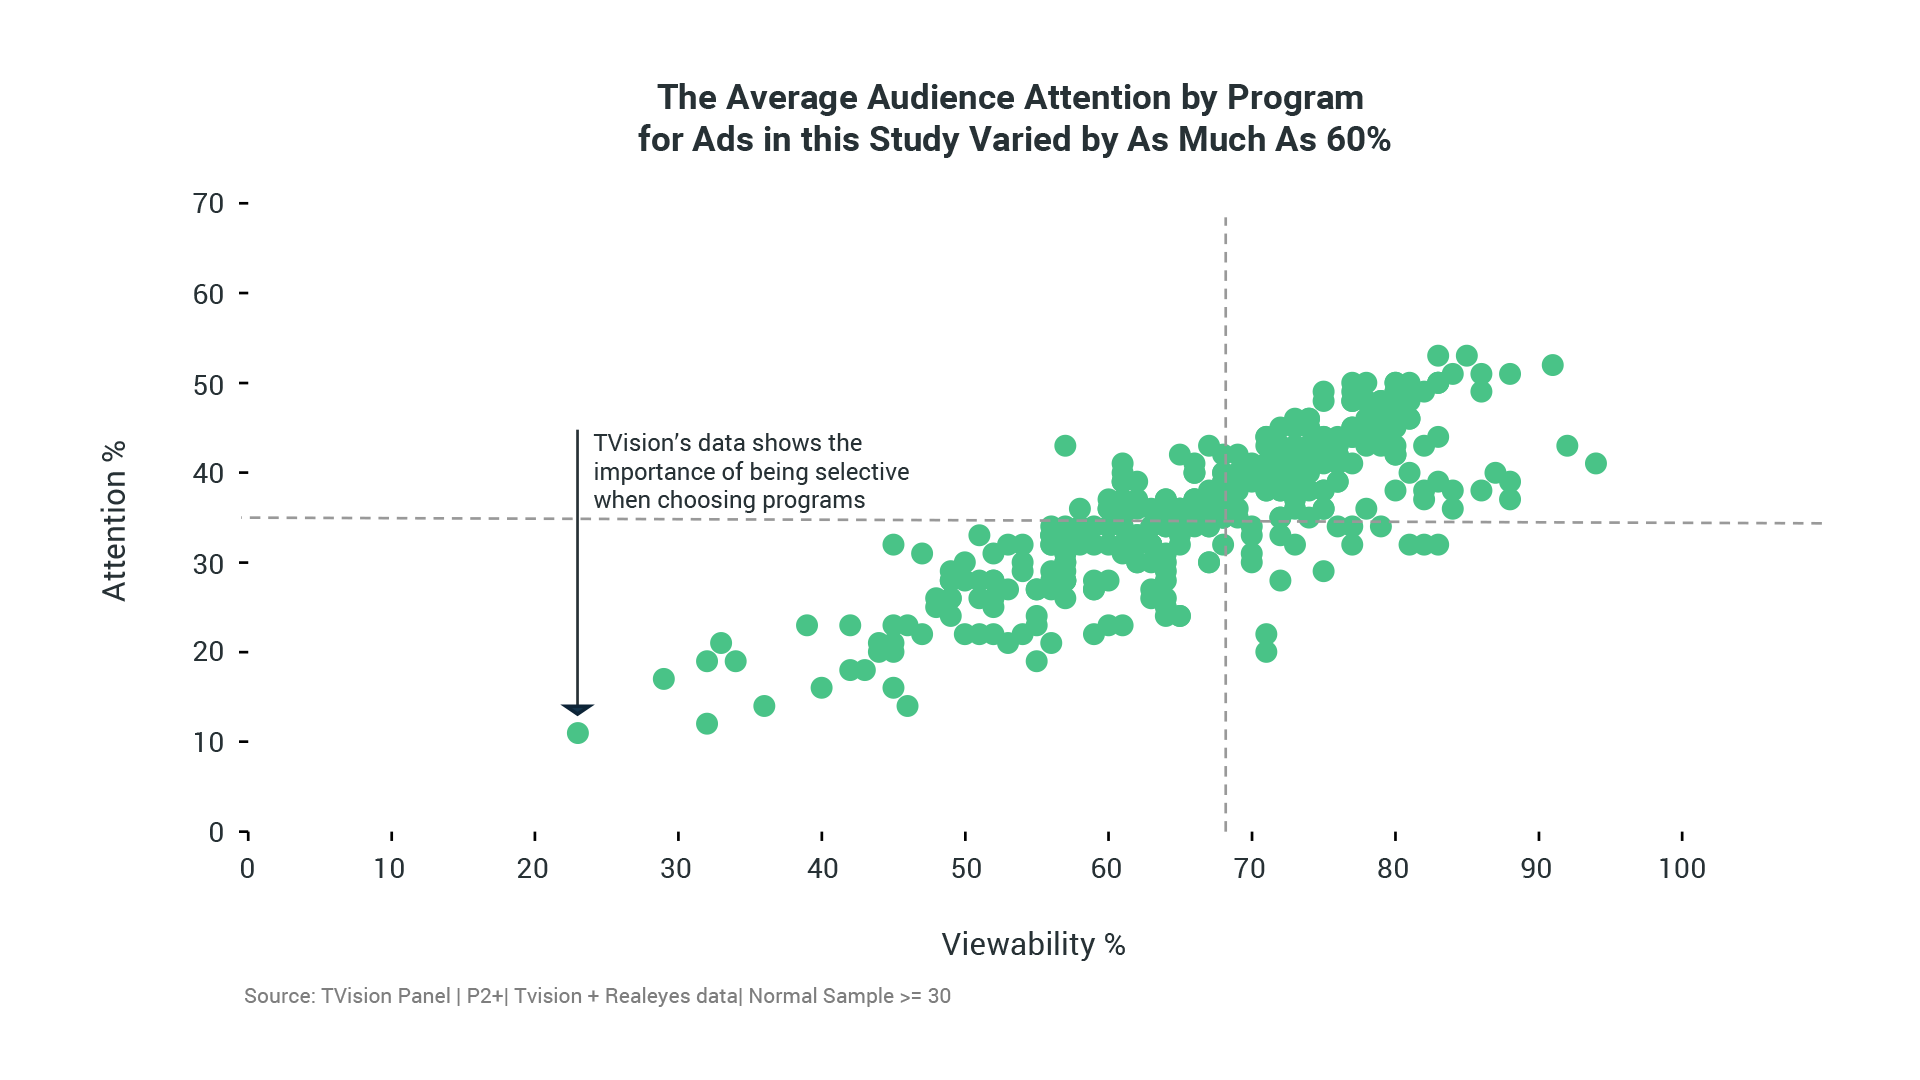
In-market attention data shows that several factors beyond the strength of the creative also impact an ad’s ability to capture attention. Daypart, network, program and pod placement are just some of the additional factors that can impact an ad’s ability to breakthrough.
For example, in the chart below we show how much attention can vary by program. Media planners may want to consider the programming’s historic engagement levels when evaluating opportunities and deciding where to direct their budgets.”
In the coming pages, we’ll help marketers understand how to best work with the creative they have. We analyzed the top three creatives in terms of TVision’s Attention % and Realeyes Quality Scores, as well as the respective bottom three creatives to compare how audiences paid attention to both in real-world settings. We’ve come up with some compelling and counterintuitive best practices around media dayparts and frequency.
Marketers Can Off-Set Low Performing Creative with Placements in High-Performing Dayparts
For low-scoring creative, selective daypart targeting can make a significant difference in audience engagement. Our analysis shows that marketers with low-scoring creative, who still need their creative to breakthrough, should consider avoiding running them during times of day where audiences are less intentional and more passive – especially late afternoon or overnight.
Low-performing creative performs significantly better during evening hours, between 6 pm and midnight, than any other daypart.
Conversely, marketers with high-scoring creative may be able to rest on the strength of their creative and achieve success without having to invest in premium primetime inventory. Ads shown between 10 am and 4 pm outperform ads shown between 6 and 10 pm, and almost do as well as ads shown between 10 pm and 12 am.

Driving the Right Frequency of Disparate Creative Quality
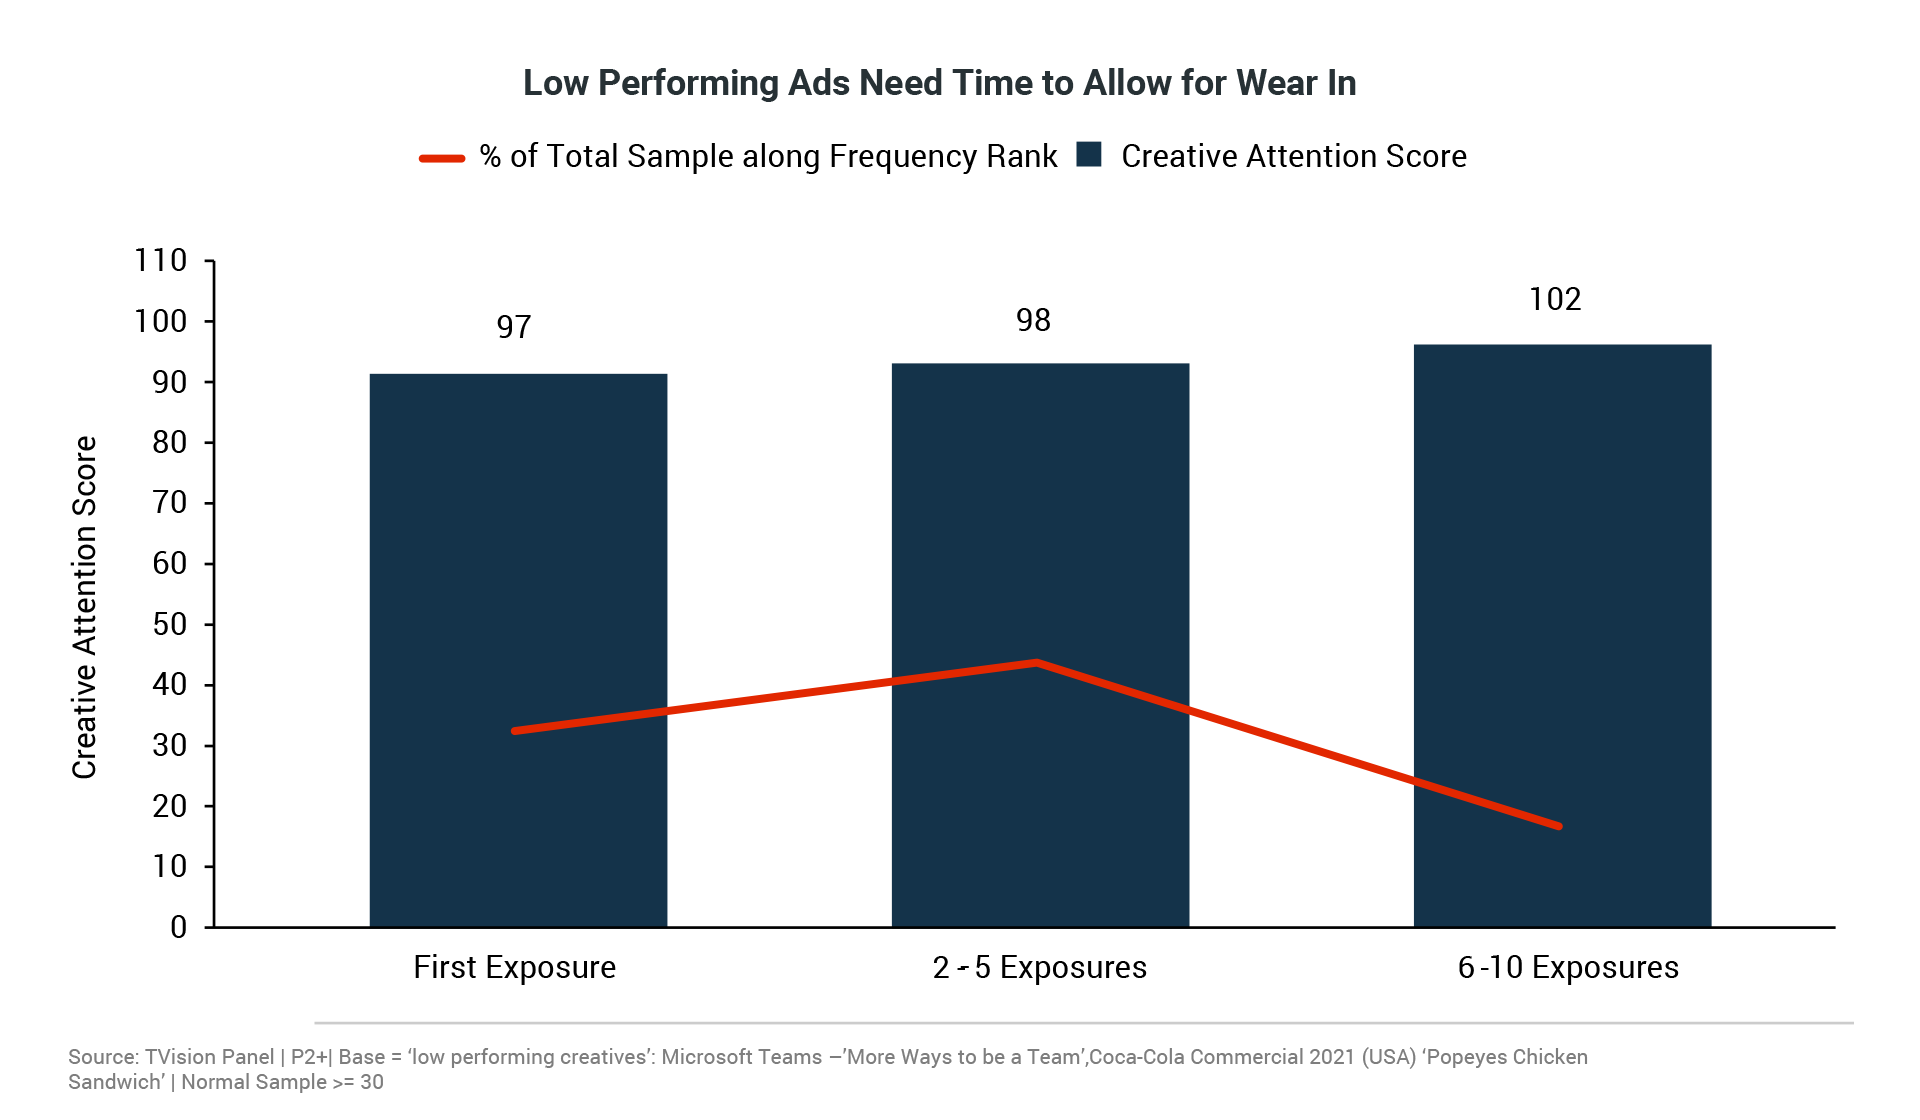
Scoring creatives as measured by Realeyes’ pre-market testing drew the most in-market audience attention during their first few exposures. However, the ads saw a 15-point drop in their TVision Creative Attention Scores when they were viewed between six and ten times.
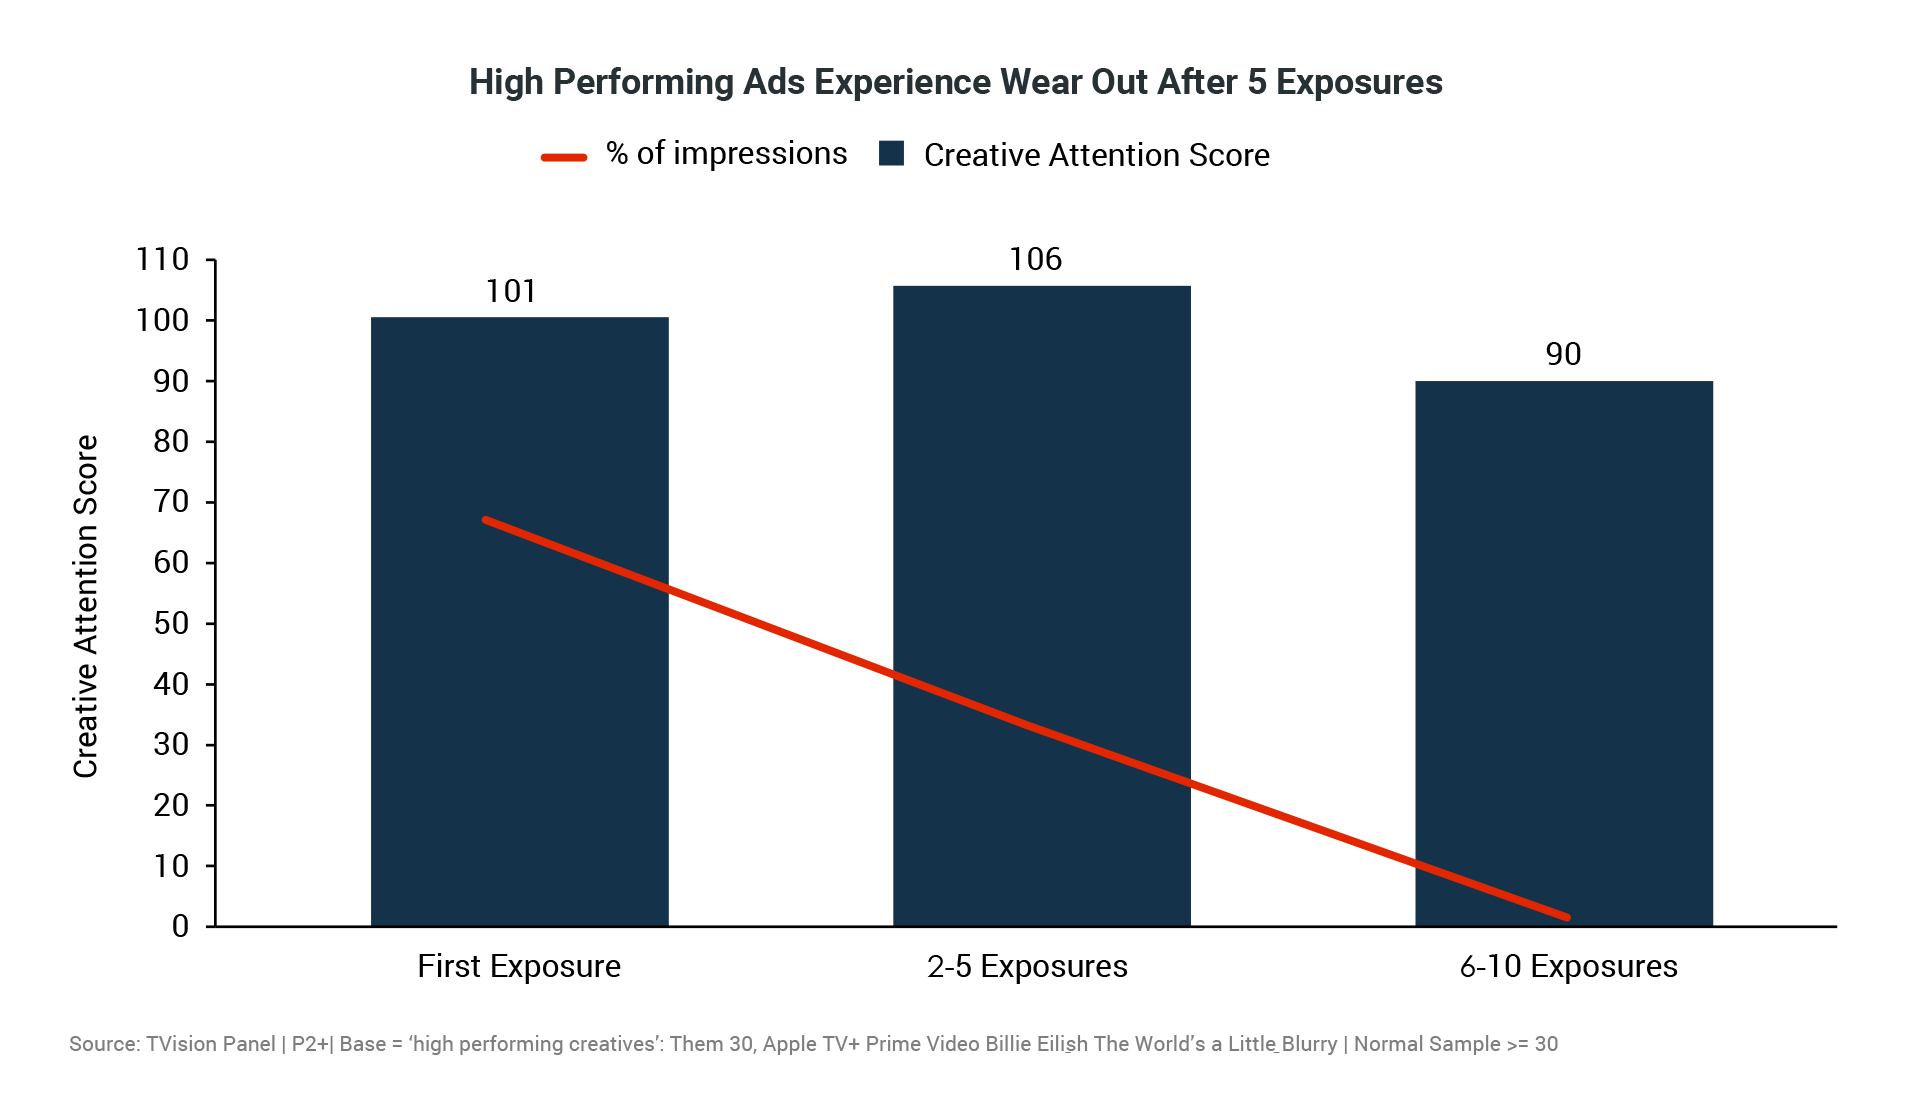
In contrast, viewer familiarity can be a benefit for low-scoring creative. We see that these ads need time to “wear in.” They performed consistently better over time, earning their highest Creative Attention Scores after six to ten exposures.
Marketers should not necessarily give up on their creative investment if they initially score poorly in pre-market testing. Instead, by monitoring the Creative Attention Score during the campaign, they can track performance as the ad wears in, rotating it out when they have a better creative option or see their attention performance begin to decline.
Samsung Case Study: With Smart Media Planning Low Scoring Creative Can Outperform
To illustrate how in-market campaigns can truly impact creative attention, we examined a campaign where a combination of optimal placement, frequency, and creative imagery helped the marketer make the best of its ad, despite a low initial Quality Score.
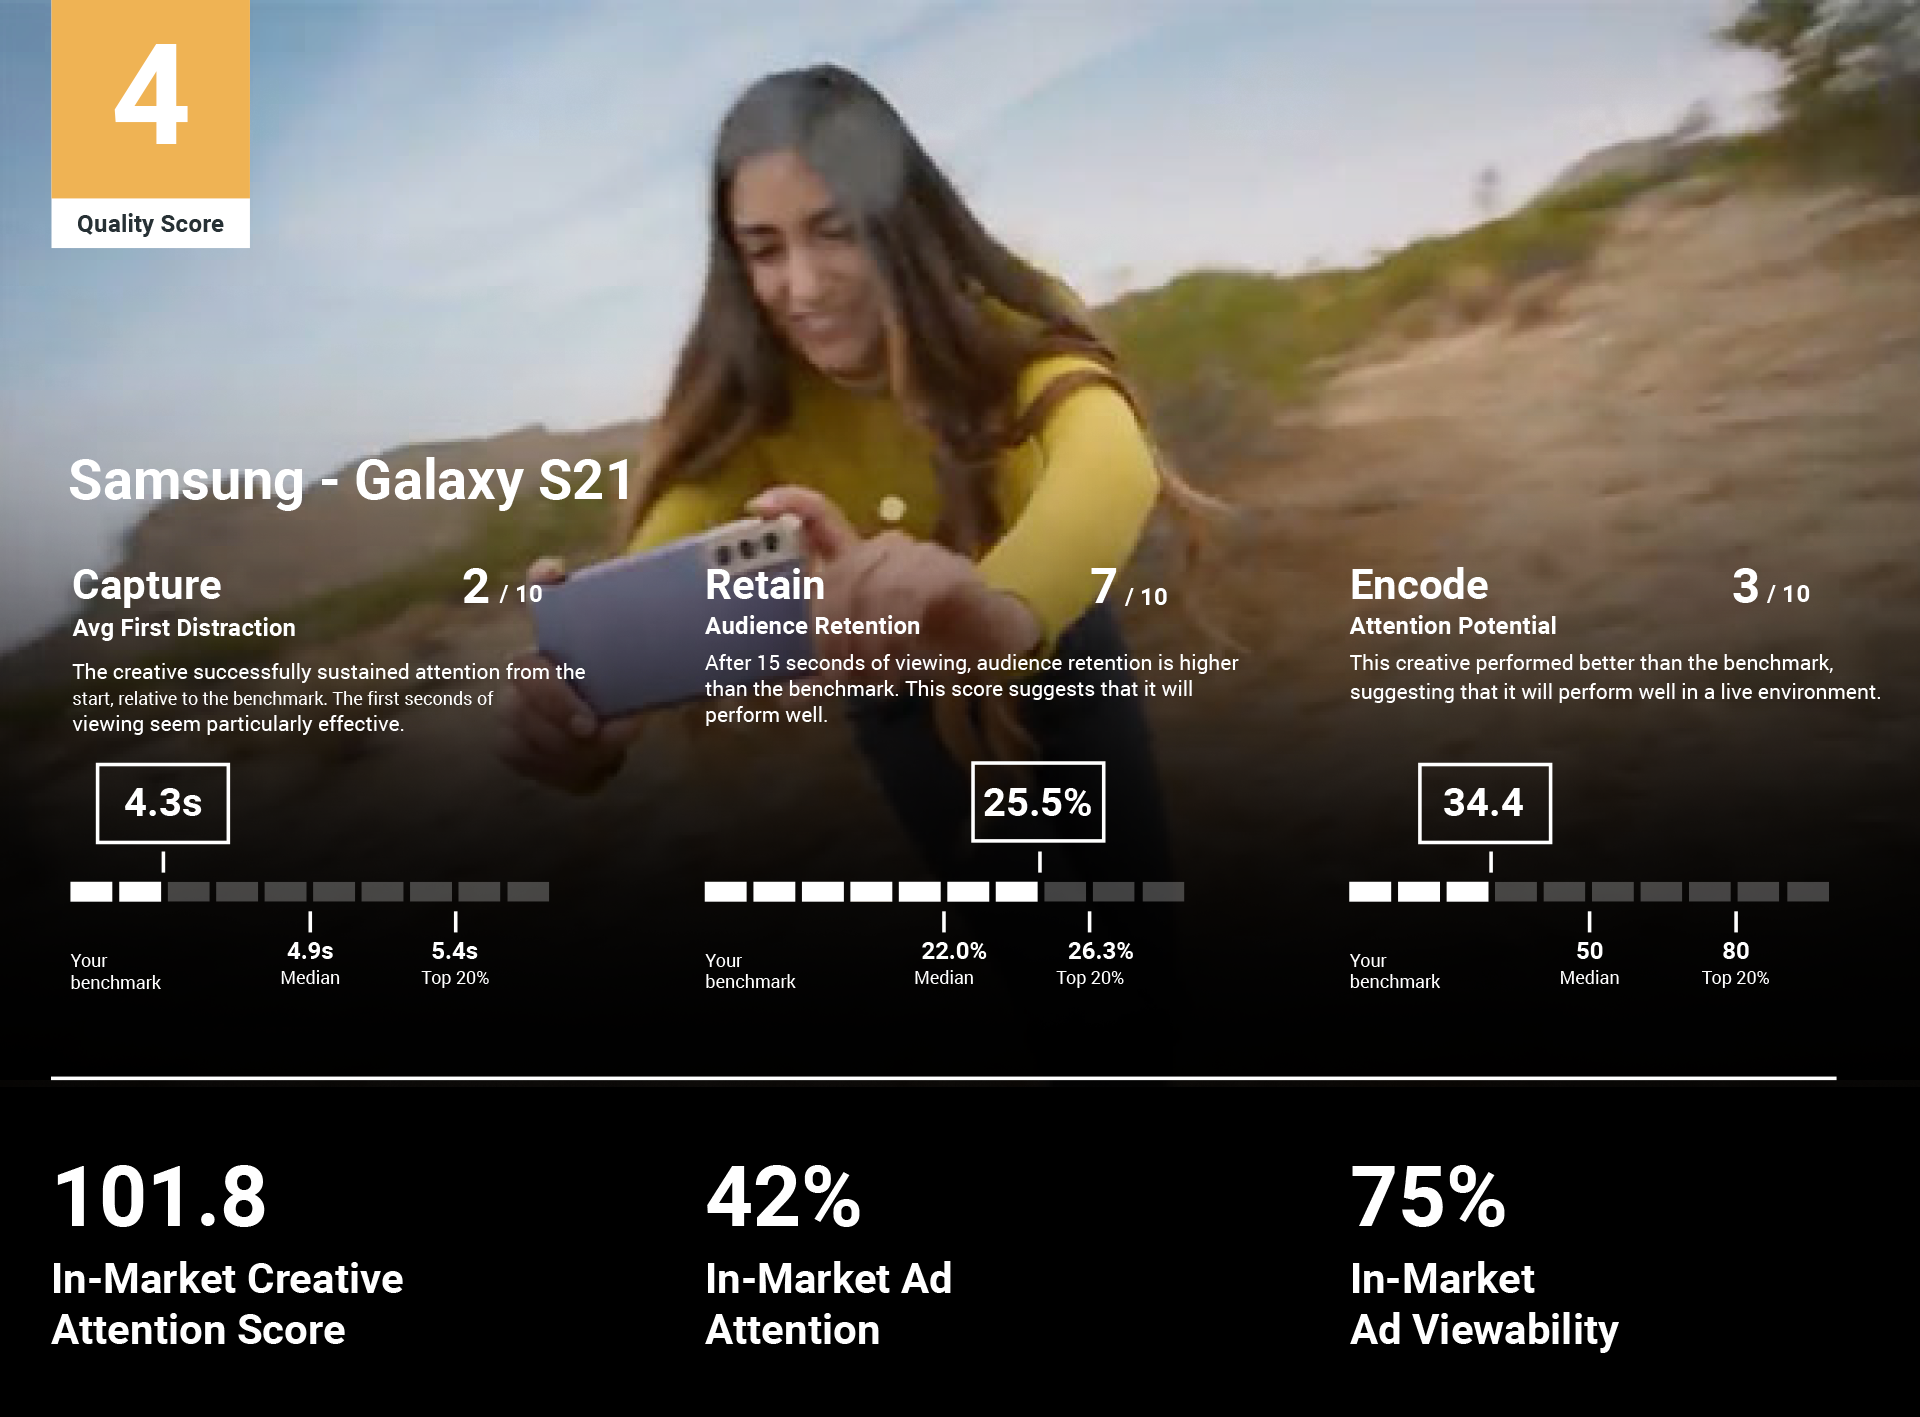
In this example, Samsung’s creative only received a 4 out of 10 on Realeyes’ pre-campaign Quality Score. As a reminder, the Quality Score is a holistic score of an ad creative’s ability to capture attention (as measured by the Capture sub-score), hold attention (as measured by the Retain sub-score), and make a lasting, emotional impact (as measured by the Encode sub-score).
In contrast, viewer familiarity can be a benefit for low-scoring creative. We see that these ads need time to “wear in.” They performed consistently better over time, earning their highest Creative Attention Scores after six to 10 exposures. Marketers should not necessarily give up on their creative investment if they initially score poorly in pre-market testing. Instead, by monitoring the Creative Attention Score during the campaign, they can track performance as the ad wears in, rotating it out when they have a better creative option or see their attention performance begin to decline.
A Quality Score of 4 is considered a -mid score. Despite testing average in a pre-market test, Samsung was able to capture above-average attention during its campaign – where it earned a TVision Creative Attention Score of 101.8. Also notable, its ad captured attention 42% of the time and was viewable by 75% of audiences – both metrics above the industry average. How did they do it?
In the following pages we’ll look at how dayparts, placements, creative techniques, and frequency played a part in gaining viewer attention.
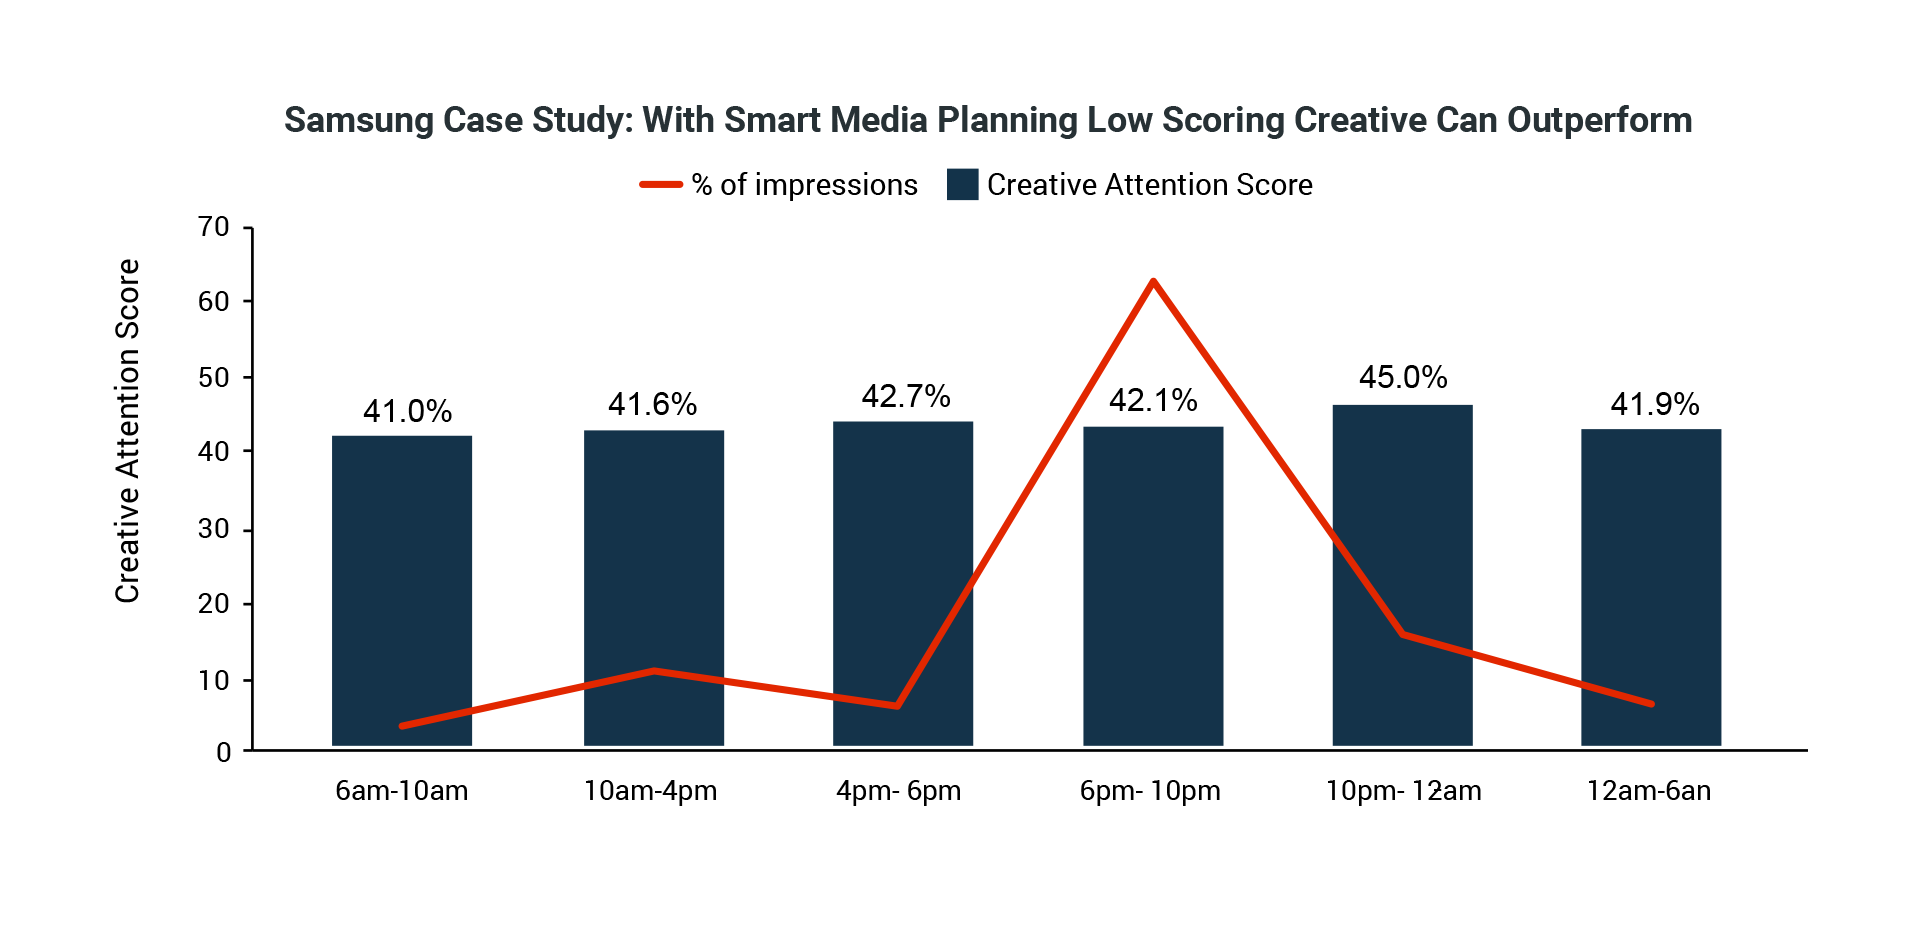
Dayparts – To illustrate how in-market campaigns can truly impact creative attention, we examined where dayparts may also have worked in Samsung’s favor. Similar to what we saw as an overall trend for low-performing creative, we see that the 10pm to 12am daypart performed above average for its ads. This daypart tranche received the highest percentage of the ad’s impression volume outside of Primetime.
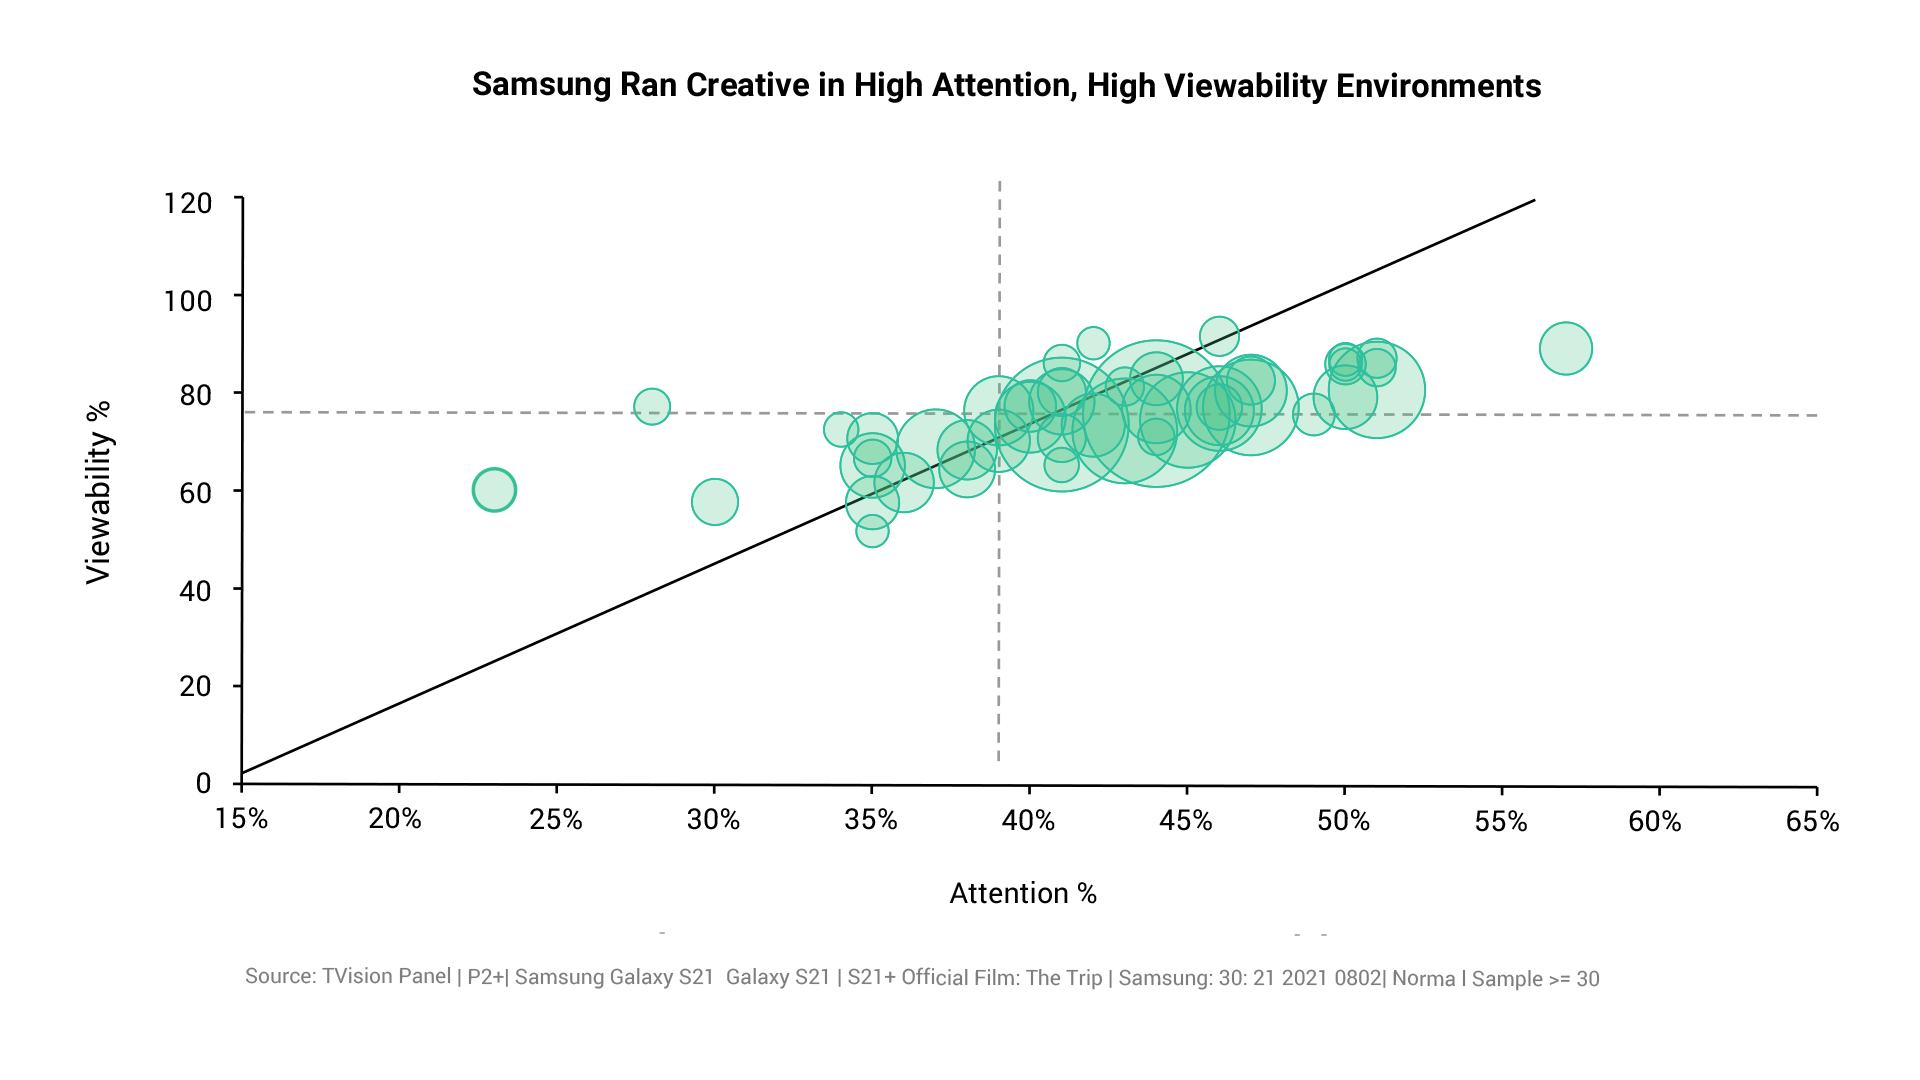
Placement – Samsung ran its creative primarily in areas where attention and viewability were above average. This means the creative could reach more viewers who remained in the rooms during the ad breaks and kept their eyes on the screen.

Creative Techniques – Soundtrack and product messaging in the voice over helps anchor attention over the multiple edits. Product shots combined with value propositions punctuated by the narrator are rewarded with attention. The darker night and cinema scenes sees a drop in attention.
Samsung’s creative captures attention at moments when product is on screen
Frequency – The Samsung ad also benefited from higher attention earned through higher frequencies. The ad saw a slight wear-in after the first exposure and even more significant gains as viewers became more familiar and saw the ad six or more times.
Despite not getting as many impressions, the nearly 8 point gain in its Creative Attention Score demonstrates the value of giving creative enough frequency to wear in.

What You Need to Do
Advertisers must think holistically about the necessary, combined impact of creative and media on viewer attention outcomes.
It is up to the paid media to access the right audience at the right time with the right attention. It is up to the creative function to deliver a video that captures and retains that attention and breaks through with the brand message.
Tools like Realeyes and TVision together help advertisers harness the potential of a holistic attention strategy that combines creative and media excellence. Realeyes enables advertisers to understand and manage creative to make media investments work their hardest, while TVision enables advertisers to understand and manage media placements to make the most of the creative with attentive audiences.
Understand your Creative’s Strengths and Weaknesses
Does your ad have a high or low Realeyes Creative Quality Score? Armed with this knowledge, you can build the best plan to drive attentive reach. For example, you can select/cut creatives, edit creatives and adjust media planning and investment allocation based on the Quality Scores of your overall creative inventory — long before the campaign launches.Make the Most of Your Daypart Strategy
If you have a low-scoring ad, make sure your plan emphasizes evening dayparts where views are intentional and less distracted. Your ad will need all the help it can get to grab viewer attention. For high-scoring ads, you can rely on your creative’s quality to engage audiences at a lower price point through more affordable daytime ad inventory.Buy Ad Inventory in Programs That Deliver High Viewability and High Attention
Your ads will work best if viewers are in the room and attentive to the screen. Programming that delivers engaged audiences will work better for any ad but is especially critical if your creative has a low pre-campaign Quality Score.Pay Attention as Ads Wear in, or Wear Out
Low scoring ads will benefit from multiple exposures, giving viewers time to become familiar with and anticipate an ad. In contrast, high-scoring ads will wear out more quickly and see their performance degrade over multiple exposures.Test Your Creative Periodically
Not only does creative wear out, but context and consumer sentiment change as well. The COVID-19 pandemic taught many harsh lessons to brands whose creatives may have worked in the past but didn’t when the environment and mood changed. Creative intelligence tells you what is likely to work in the market and why certain creatives work and don’t so you can plan more effectively. You may have audience attention, but do you have the right kind of audience attention?
Correlations Between Pre-Market and In-Market Scores
There is a modest, yet definitive correlation between Realeyes’ pre-market Quality Score and TVision’s in-market Creative Attention Score (CAS). Across all measured brands & categories, there was a correlation of +.27. Some industries showed much stronger correlations than others:
Consumer Technology: Ads from these brands showed the highest overall correlation – (then add existing copy). This suggests that pre-campaign testing for this creative was a good indicator of in-market performance.
CPG: While the overall Realeyes Quality Score and TVision CAS were correlated at +.35, some Realeyes sub scores such as Capture and Encode showed higher correlations – showing that they were effective at capturing attention quickly and generating an emotional response.
Streaming Entertainment: These ads demonstrated a high correlation between the Retain sub score and overall in-market attention for the campaign. This indicates that if these ads held attention in pre-campaign testing they were likely to hold attention in audiences’ living rooms as well. In fact, this correlation was one of the highest in this study.
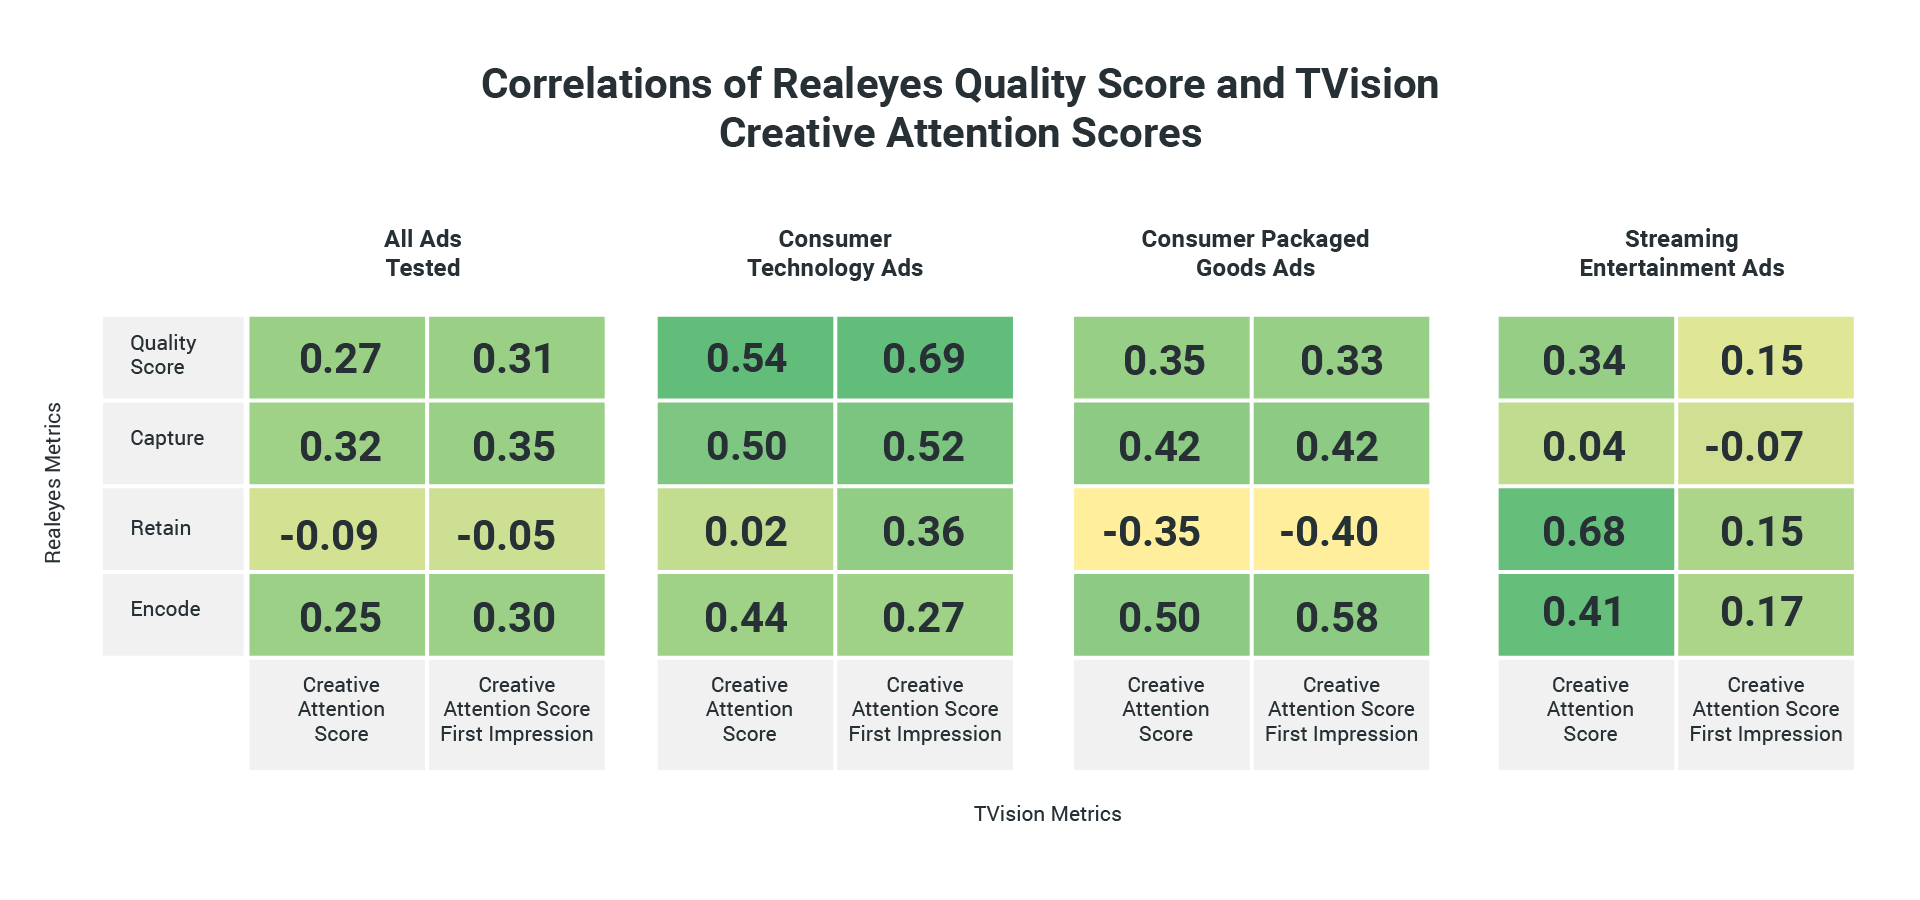
Next, we took a look at whether pre-campaign testing was more closely correlated to audience attention for the first in-market impression since influences like ad wear out wouldn’t yet be a factor. In most cases this proved to be true.
Overall, if an ad was viewed for the first time in market, correlation rose to +.31. Likewise, industries with high overall correlations also saw a stronger correlation when people viewed the ad for the first time.
CPG: Ads in this category performed similarly at the first impression as they did throughout the campaign. Only the Encode sub score, a measure of the ads’ lasting emotional impact, rose nominally from +.5 to +.58
Consumer Technology: The correlation between the two metrics rose to +.69 (from +.54 overall). Interestingly, while the Retain sub score showed lower correlation with the overall campaign, it was more closely correlated with the first impression. This indicates that after audiences saw the creative once, these ads were less likely to hold audience attention through repeated exposures.
Streaming Entertainment: These ads were actually less correlated at the first exposure than for the overall campaign. This suggests that ads in this category may need more time to wear in and build audience interest. This differential makes sense. These shows are often new programs with low initial recognition and may need more time to build interest.
Study Design
The study included 40 TV ads with durations of 15 or 30 seconds that ran in the U.S. Brands included Amazon Prime, Apple TV+, Arby’s, Burger King, Coca-Cola, Disney+, Domino’s Pizza, Facebook Groups, Fiji Water, Google, Haribo Gold-Bears, HBO Max, Hershey’s, Hulu, Kit Kat, M&M’s, Microsoft Teams, Mountain Dew, NBC, Netflix, Pepsi, Popeyes, Red-Bull, Samsung, Subway, Taco Bell and Wendy’s.
Realeyes Quality Score determines the strength of a video creative asset based on: its ability to Capture attention in the first seconds; Retain attention through at least 15 seconds; and Encode the brand message by eliciting an emotional response while paying attention. Realeyes uses front-facing cameras on laptops, tablets and mobile phones to measure the attention and emotional reactions on a second-by-second basis to videos among opt-in viewers.
TVision uses a panel to passively measure how people watch linear and CTV in real-world situations. Every time panelists walk into their living room, TVision’s technology detects who the viewer is and what their eyes are looking at – enabling TVision to measure attention of TV programming and advertising on a second-by-second basis. TVision’s Creative Attention Score is a signal of creative breakthrough – indicating whether people pay more attention to one ad versus others in the same commercial pod.


Using front-facing cameras and the latest in computer vision and machine learning technologies, Realeyes measures attention and emotion of opt-in participants as they watch video content online. This empowers brands, publishers and technology platforms to inform and optimize their content as well as target the right videos to the right audiences.
Realeyes’ technology applies facial coding to predictive, big-data analytics, driving bottom-line business outcomes for brands and publishers. Founded in 2007, Realeyes has offices in New York, London, Tokyo and Budapest.
Customers include brands such as Mars Inc, Church & Dwight, Hershey’s and Expedia, agencies Ipsos, Dentsu and Publicis, and media companies such as Google, WarnerMedia and Teads.
TVision provides second-by-second, person-level data about how people watch TV – who’s watching, what they’re watching, and how much attention they are paying to both linear and streaming TV.
Advertisers, agencies, networks, streaming content providers, measurement companies, and data platforms use TVision data to make more informed media decisions, measure performance, produce content that engages audiences, and benchmark their results against competitors. TVision is headquartered in New York City, with offices in Boston and Tokyo.
Contents:
- What You Need to Know
- Specific Creative Elements Can Help Drive Attention & Engagement
- Maximizing Low-Performing Creative and Driving Efficiency of High-Performing Creative
- Marketers Can Off-Set Low Performing Creative with Placements in High-Performing Dayparts
- Driving the Right Frequency of Disparate Creative Quality
- Samsung Case Study: With Smart Media Planning Low Scoring Creative Can Outperform
- What You Need to Do
- Correlations Between Pre-Market and In-Market Scores
- Study Design
Share this: