Introduction
For as long as companies have created ads, many have used human actors to connect to their audiences. But how valuable is it to have a human in an ad?
Realeyes has been measuring human response to videos for a decade and has amassed a database of nearly 50,000 video ads, viewed by 6.7 million people.
What You Need to Know
-
Ads that feature humans drive down the cost of quality exposures in campaigns by 9%, yet nearly one-third don’t feature humans.
-
When humans were present throughout the ad, Creative Efficiency increased 10%.
-
Many industries with the highest cost of quality exposures used humans the least.
What You Need to Do
Use Human Actors: Our data prove that human presence increased Creative Efficiency on average. If you’re not using humans in your ads, you are wasting media investment and messaging opportunities.
Include Humans in as Many Scenes as Possible: Creative Efficiency rises as an ad retains attention. Integrating human presence throughout an ad’s duration can hold attention and prolong attentiveness.
Avoid Cliche Gender Roles: Zig where your competitors zag by breaking gender stereotypes that have a negative impact on Creative Efficiency.
Human Presence is Key to Ad Effectiveness
Humans were featured only in 70% of all tested video ads, but ads with humans drove more emotion, higher Creative Efficiency and lower costs of high-quality campaign exposures, which we determine by estimating the cost of one thousand quality media exposures (qCPM).
Quality media exposures are determined by Capture, the ability to attract attention; Retain, the ability to keep that attention throughout the ad, and Encode, the ability to encode the brand message into the brain through emotional engagement. We then derive the cost of reaching those quality exposures as derived from a nominal cost of one thousand impressions (CPM). qCPM decreased 9% in ads that featured humans versus those that did not.
However, within managing for growth, margin or both, advertisers often thwart their potential by over-relying on media and channel spend as sole inputs into marketing performance models.
What’s missing? The almighty creative.
Human Presence in even more powerful if used in every scene
| Creative Efficiency | qCPM | Capture | Retain | Encode | ||
|---|---|---|---|---|---|---|
| Human Presence Group | No | 0.491 | 27.18 | 5.234 | 0.354 | 32.343 |
| First column | Second column | Third column |

Our PreView database proves that including humans in ads drives higher Creative Efficiency, increased emotional response, and a lower qCPM. And yet 30% of ads fail to feature any humans. This is a simple fix that gives creative teams a huge opportunity to lean into new forms of storytelling, especially in industries where human actors are sporadically used.
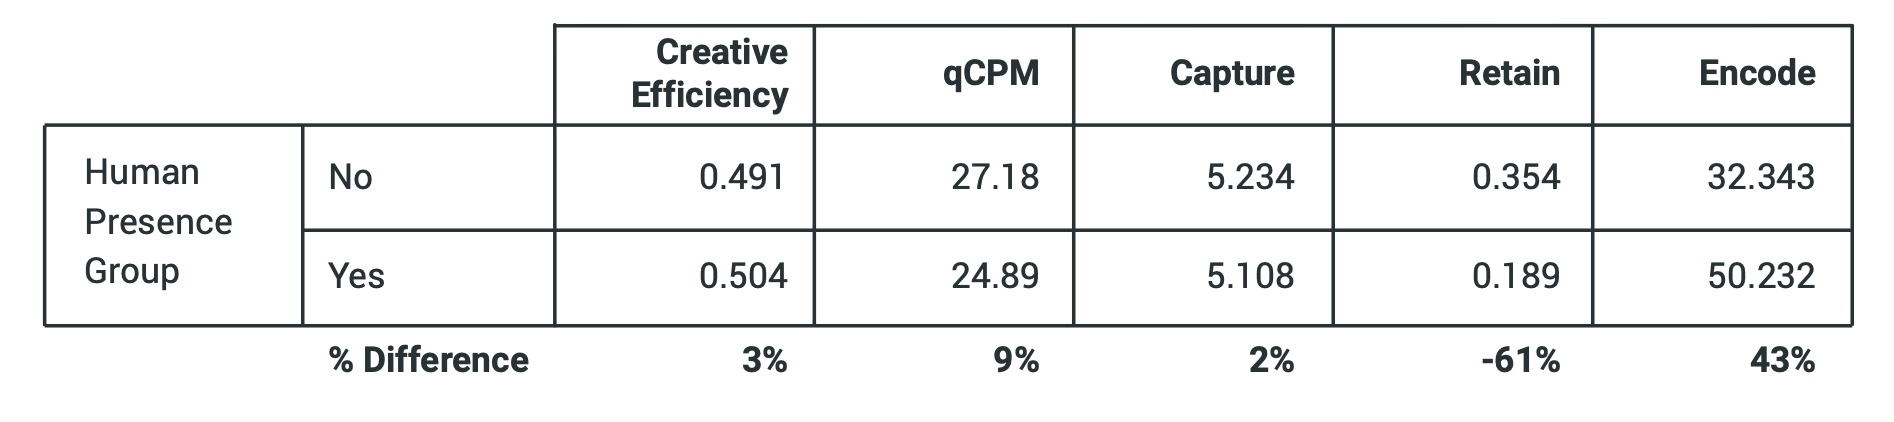
Ads without humans had on average qCPMs 15% higher than ads with humans in all scenes. Although human presence can have a negative effect on an ad’s Retention, it does drive a higher Encode score. This makes sense: humans respond emotionally to other humans, much more so than things.
In addition, Creative Efficiency increased on average 10% when humans were present in all scenes of an ad.
Creative Efficiency increased on average 10% when humans were present in all scenes of an ad
Human Presence Effects Industries Differently
When viewing the qCPMs of various industries that have at least 1,000 videos in our database, we found a continued correlation between human presence and the cost of reaching quality audiences.
The industries that were the most cost-effective to reach quality exposures were telecom, internet services and ISP; style & fashion, home & garden, and beverages. All were in the top six highest percentage of human presence featured in ads.
Conversely, it cost the most to reach quality audiences (highest qCPM) in the retail shopping, technology and computing, sports, and automotive industries. Of those, sports and retail shopping featured the least amount of scenes with humans present among all industries.
The industries that were the most cost-effective to reach quality exposures were telecom, internet services and ISP, style & fashion; home & garden, and beverages


Move Beyond Gender Stereotypes
In ads where gender could be identified, females appeared more frequently than males. The Creative Efficiency of using females in videos versus using men was nearly the same, demonstrating that whether you use males or females, it’s better to use humans than not.
The presence of females in ads compared to no females increases Creative Efficiency by 2% and decreases qCPM by 7%. For males, Creative Efficiency increases by 2% and qCPM decreases by 8% when they’re in ads versus not featured.
Some industries over-index on one gender versus another, based on stereotypes or traditional gender roles. In the personal care industry, females are featured in 79% more ad scene seconds than males; other industries that indexed high on female presence included pharmaceuticals (40%) and home supplies (30%). And yet male presence had a slightly higher creative efficiency than females in pharmaceuticals.
Conversely, males were used in 36% more tested ad scenes in News and Politics. And yet, ads in this category with female presence had the third-highest difference in creative efficiency compared to ones with males.
In the personal care industry, females are featured in 79% more ad scene seconds than males; other industries that indexed high on female presence included pharma' (40%) and home supplies (30%).

While we have not yet explored how female and male viewers respond directly to females and males on screen, it is a topic worthy of discussion and one we anticipate exploring in the future.
It demonstrates that advertisers should test different genders in their creative and use the highest performing before launching. For example, a recent study of one client’s campaign found viewers responded more favorably to female narration than male.

Methodology and Definitions
We analyzed over 41K media files over an 11-year period (2011 to 2022). Among the sample, 80% are from 2017 through 2021. The total panel size consists of >6.3 million global views all over the world.
The analysis included 4.3k unique brands, with the top 50 brands by volume responsible for 25% of all tests. Among all tests, 80% occurred in the United States, United Kingdom, France, Germany, Canada, Brazil, Italy, and Russian Federation.
The creative attention scores are provided by Realeyes’ PreView, which measures the facial queues and eye movements of participants as they watch video from desktop and laptop computers, and mobile devices. Each ad received over 150 views among participants.
Human Presence: PreView detects human presence in an ad on a second-by-second basis.
Creative Efficiency: the extent to which a creative captures the full value of a nominal CPM based on attentional scores; calculated by dividing a video creative’s CPM by its qCPM.
Capture: Ability to capture audience attention in the first seconds.
Retain: Ability to retain the audience throughout the ad.
Encode: Ability to encode the brand message into the brain through emotional engagement.
qCPM: An estimated cost of one thousand quality media exposures based on Capture, Retain and Encode performance, and derived from a nominal cost of one thousand impressions (CPM).