Introduction
We examined 42 YouTube ad creatives across seven major CPG brands, with the goal of demonstrating the efficacy of Creative Attention to model efficiency and share of voice (SOV).
Our study mapped creative attention to cost, illustrating how advertising that performs poorly on attention increases cost because the creative isn’t as impactful. It concluded that managing for brand growth requires managing for attention, which in turn requires managing the creative and media in campaigns like a portfolio.
Why It Matters
- Creative is often the dominant influence on campaign success (with estimates varying its effect to be anywhere from 45% – 60%. Using Creative Attention makes for a more useful SOV model because it accounts for the actual likelihood of audience impact, not just impression delivery and the opportunity to see.
- Videos that perform well on attention earn a lower quality CPM (qCPM) than videos that perform poorly on attention, because those creatives fail not only to earn and capture attention, but also to move audiences emotionally.
- Brands should lean harder into Creative Attention to drive share of voice (SOV) and lower their effective CPM.
Increased SOV Drives Significant Competitive Advantage
Two of the top growth concerns of advertising leaders are efficiency and SOV. Greater advertising efficiency can drive cost savings and profitability and unlock opportunities for capital reinvestment. Greater SOV, particularly among market leaders who exploit disequilibrium by outspending their competitors, can drive a relative effect on sales market share.
However, within managing for growth, margin or both, advertisers often thwart their potential by over-relying on media and channel spend as sole inputs into marketing performance models.
What’s missing? The almighty creative.
Creative’s Role in Campaign Performance
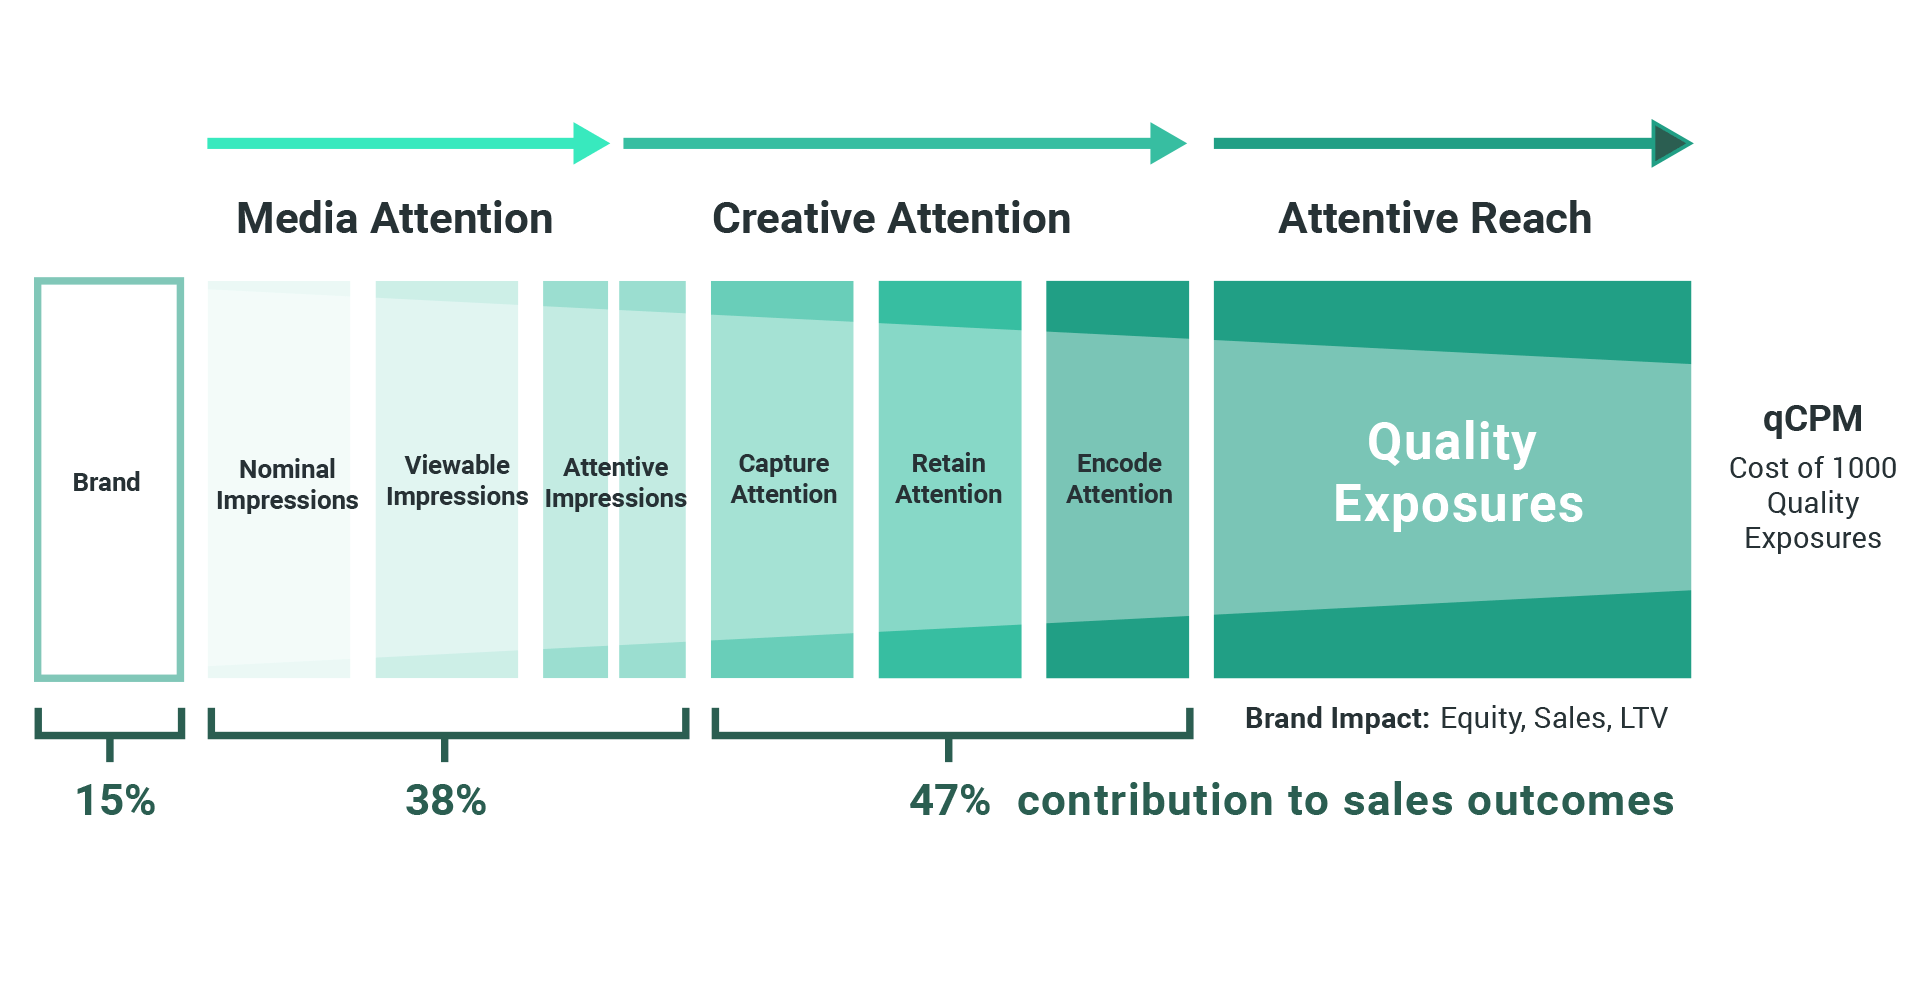
Creative is perhaps the most important determinant to advertising efficiency and SOV, though it is the most neglected in conventional market-mix, attribution and SOV models. According to NCSolutions data, creative is the element of advertising that contributes the most to sales at 47%. The remaining sales contributions result from brand equity (a 15% contribution) and media levers like reach, targeting, recency and context (38%).
Google’s Digital Marketing Evangelist, Avinash Kaushik weights creative even more: “It turns out … the creative has approximately 60% influence on the ultimate success of your campaign! The creative is what matters, and, unfortunately, few people who do modern analytics focus on the creative.”
Share of Voice by Quality Exposures

Using Attention to Quantify Creative Performance
How does one quantify creative into concepts of efficiency and SOV? Creative Attention measures are a powerful solution to quantifying creative influence. These measures can be applied to manage tactical optimizations far more than crude A/B tests, to achieve greater efficiency and SOV.
What about Media Attention? It is important, too, and part of an attentive reach model. However, we are addressing creative quality, specifically, because of its outsized impact on success amidst its absence from common brand and advertising performance models.
Creative Efficiency & Share of Voice
Applying Creative Attention to Understand Efficiency and SOV

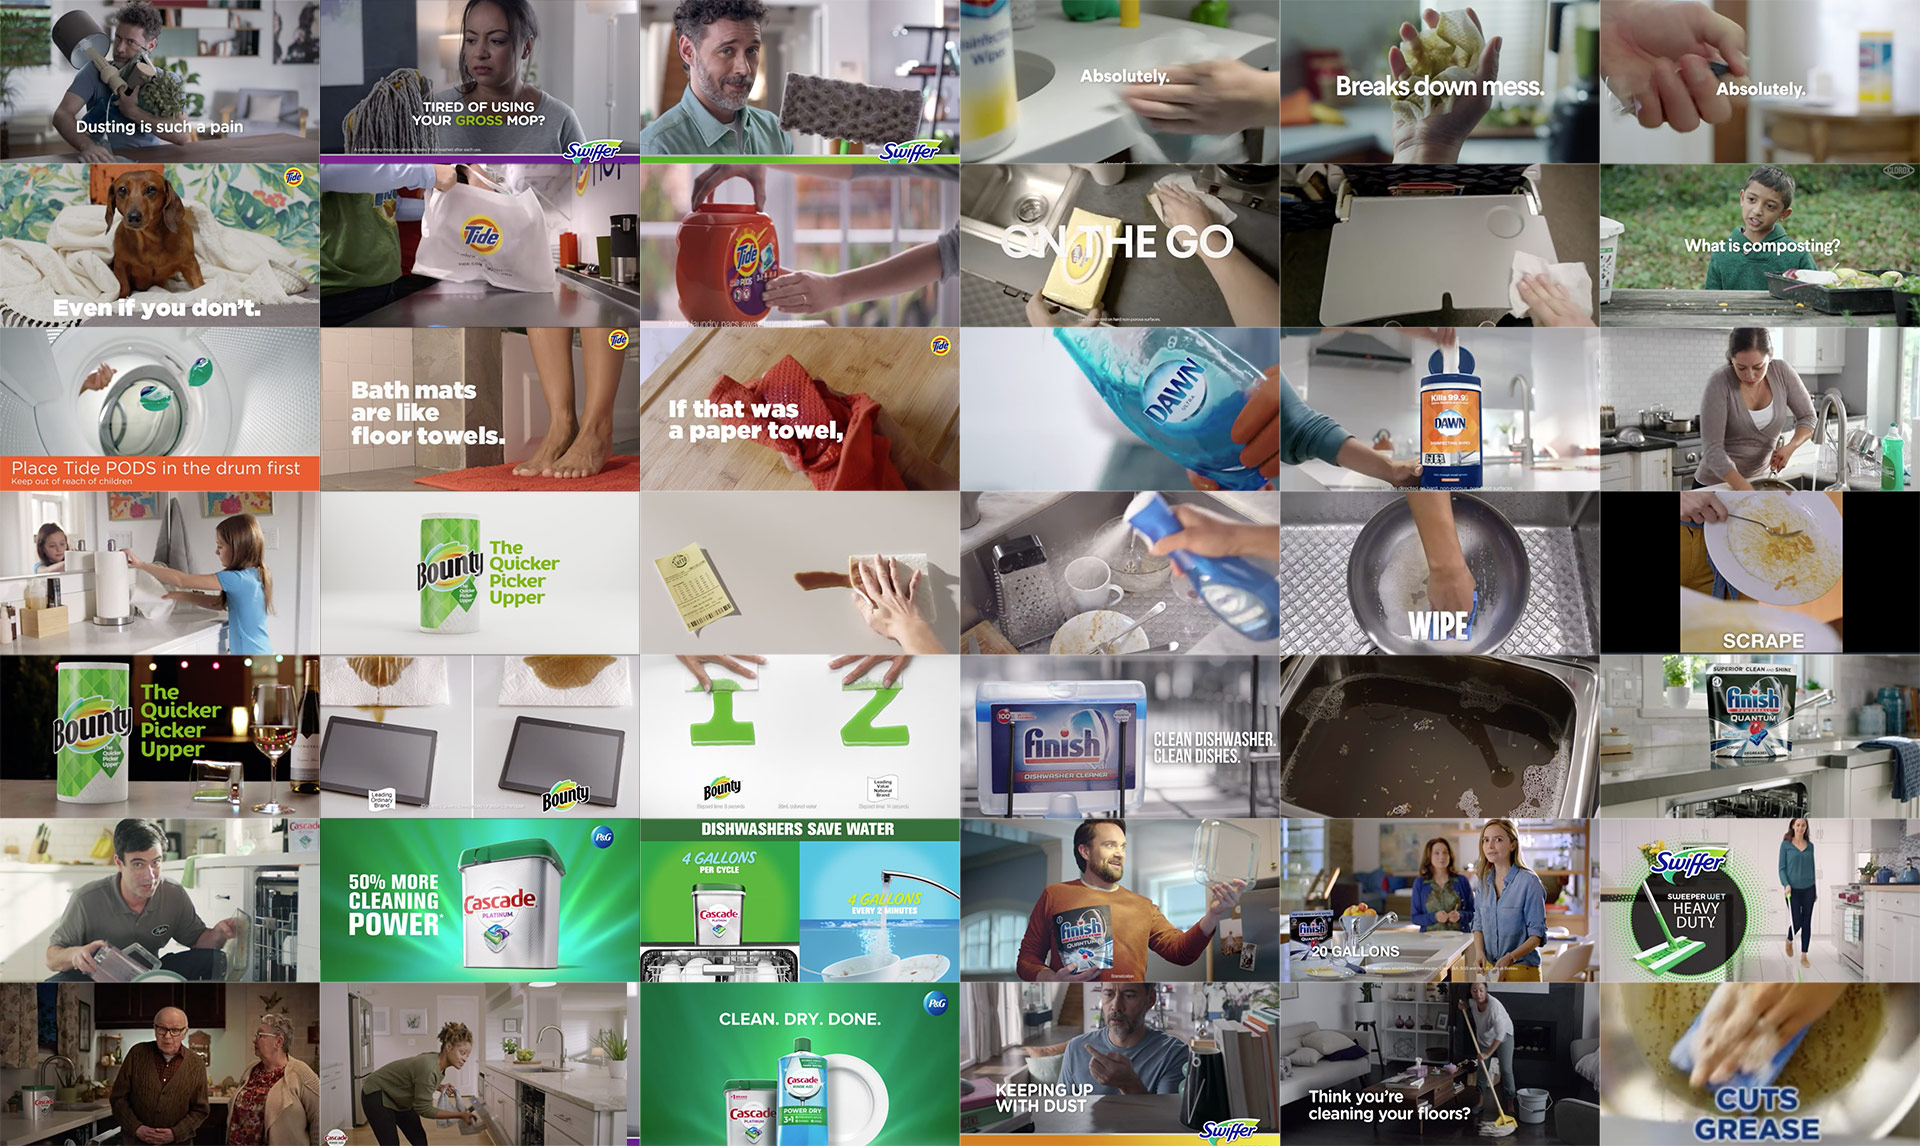
To demonstrate the efficacy of Creative Attention to model efficiency and SOV, Realeyes created a competitive scenario using 42 YouTube ad creatives across seven major CPG brands in the $35 billion household-cleaning category, using the company’s PreView creative measurement tool.
PreView determines a video creative’s ability to Capture and Retain Attention, and then Encode the brain by prompting an emotional response. These measures culminate in an overall Quality Score, which Realeyes has validated to predict video engagement and brand favorability. (For more information, see “Methodology and Definitions”.)
From these attentional measures, PreView also outputs an effective dollar cost of 1,000 quality media exposures for each video creative based on a nominal $10 CPM.
Essentially, videos that perform well on attention earn a lower quality CPM (qCPM) than videos that perform poorly. This advertising therefore becomes more expensive because it fails to earn and capture attention and to move audiences emotionally. Using Creative Attention makes for a more useful SOV model because it accounts for the actual likelihood of audience impact, not just impression delivery and the opportunity to see.
PreView also outputs Creative Efficiency, which is the extent to which a creative captures the full value of a nominal CPM based on attentional scores (in mathematical terms, that’s the CPM divided by the qCPM).
Creative Attention’s Impact on Hypothetical $1 Million Media Spend
If we apply a hypothetical $1 million media spend equally for each brand’s creative video portfolio, then we can see how different creative portfolios can radically influence the efficiency and actual cost of an exposure. For example, Tide’s qCPM is $13.97 and SOV is 22%, while Bounty’s qCPM is $42.86 and SOV is 7%., so between these two brands, there is a 3X delta in the cost of a quality media exposure, resulting in a 3X difference in SOV.
Theoretically, a brand with dominant creative could have the luxury to manage for margin or reinvest spend to achieve more quality exposures and higher SOV for the same spend. Conversely, brands whose creative performs poorly on attention may have limited options – either outspend to compensate for poor creative, or cut the low performing creative, weight the top creative, and edit the middling creative.
Managing for brand growth requires managing for attention. And managing for attention requires managing the creative and media in your campaigns like a portfolio. It’s important to address performance of the entire group, while diagnosing and addressing individual assets. It also is critical to understand which creative strengths of a video play best to different devices and channels. The financial concept of the efficient frontier applies well here: create the optimal portfolio of creative and media to offer the highest expected return with the lowest level of risk.
This is a C-suite mandate, a call for an Attention transformation. Brand leaders serious about sustained growth must undo decades of workflow inertia that have put creative and media into silos without shared KPIs and with little orchestration. Creative should be about more than just big ideas and nice video reels, and media should be about more than the high tonnage of low-cost CPMs. Attention is the bridge to bring them together, while creating greater resonance with the consumer.

Methodology and Definitions
Realeyes used its PreView Creative Attention measurement tool to test on desktop 42 YouTube ads, including six videos from seven brands in the CPG category of household cleaning products. The brands selected were Bounty (Procter & Gamble), Cascade (P&G), Clorox (The Clorox Company), Dawn (P&G), Finish (Reckitt), Swiffer (P&G), and Tide (P&G). The Desktop panel viewed the ads 6,783 total times with an average of 160 views per ad.
Quality Score: a composite metric reported on a scale of 0-10 and measures a video’s ability to perform in-market. It includes three critical elements: Capture, Retain and Encode.
Capture: Ability to capture audience attention in the first seconds.
Retain: Ability to retain the audience throughout the ad.
Encode: Ability to encode the brand message into the brain through emotional engagement.
qCPM: An estimated cost of one thousand quality media exposures based on Capture, Retain and Encode performance, and derived from a nominal cost of one thousand impressions (CPM).
Creative Efficiency: the extent to which a creative captures the full value of a nominal CPM based on attentional scores; calculated by dividing a video creative’s CPM by its qCPM.