Meta Decodes Advertising Attention by Environments in the Wild
Challenge
As a pioneer in ad formats and advertising measurement, Meta wanted to better understand how the proliferation of different digital environments changed how people interact with ads.
The introduction of feeds, stories, and other formats has increased the complexity of the landscape exponentially yet advertising mental models and categories have not kept up with the innovation on the product side. We still use categories to group digital media together, such as “digital video” and “digital display,” which may not be the best way to understand these media in a modern landscape with increased complexity.
Meta wanted to address these issues and look at the problem in a rigorous, data-driven way. The objective was to better describe consumer behavior around different ad formats, and evaluate whether there are distinct media environments within digital video.
Key Takeaways
There are different profiles of consumer behavior across environments.
Despite this, brand outcomes are comparable – suggesting each environment achieves value in a different way.
Attention has a different relationship with outcomes across environments and users, which should inform how the industry uses these metrics.
Marketers should tailor creative to take advantage of how attention typically ebbs and flows over the course of a creative in each environment.
Behavioral norms vary by audience within environment.
Match creative to environment to best leverage each environment’s unique strengths.
Solution
The study featured 6,076 participants randomly assigned to one of 15 different ad placements. Ads were sourced from 5 participating brands across a variety of industries. Participants viewed ads across realistic simulations of 7 different apps: Facebook, Instagram, Hulu, Snapchat, TikTok, X (Twitter), and YouTube through a mobile browser. Data was collected from December 9-24, 2022.
Each placement was defined as belonging to one of three environment types:
Feed
Vertically scrolling feed with ad units less than full screen and ads in between content.
Placements:
Facebook Feed, Instagram Feed, Twitter Feed
Short Form
Vertically or horizontally scrolling feed with full screen ads in between content.
TV or user generated content viewed in online player with ad appearing before or within the video (pre or mid-roll).
Placements:
Facebook InStream*, Hulu Pre & Mid Roll*, YouTube Non-skippable*, YouTube Skippable*
Realeyes provided attention measurement through participants’ forward-facing cameras, classifying whether the user was paying attention in each frame using neural network processing. EyeSquare provided simulated environments with interactivity and tracking which participants accessed via browser, and VidMob adapted creative where necessary for individual placements to meet best practices.
Participants were exposed to 16,835 ad impressions and sample sizes were >300 participants per tested placement, making this one of the largest studies of attention in the media landscape.
Results
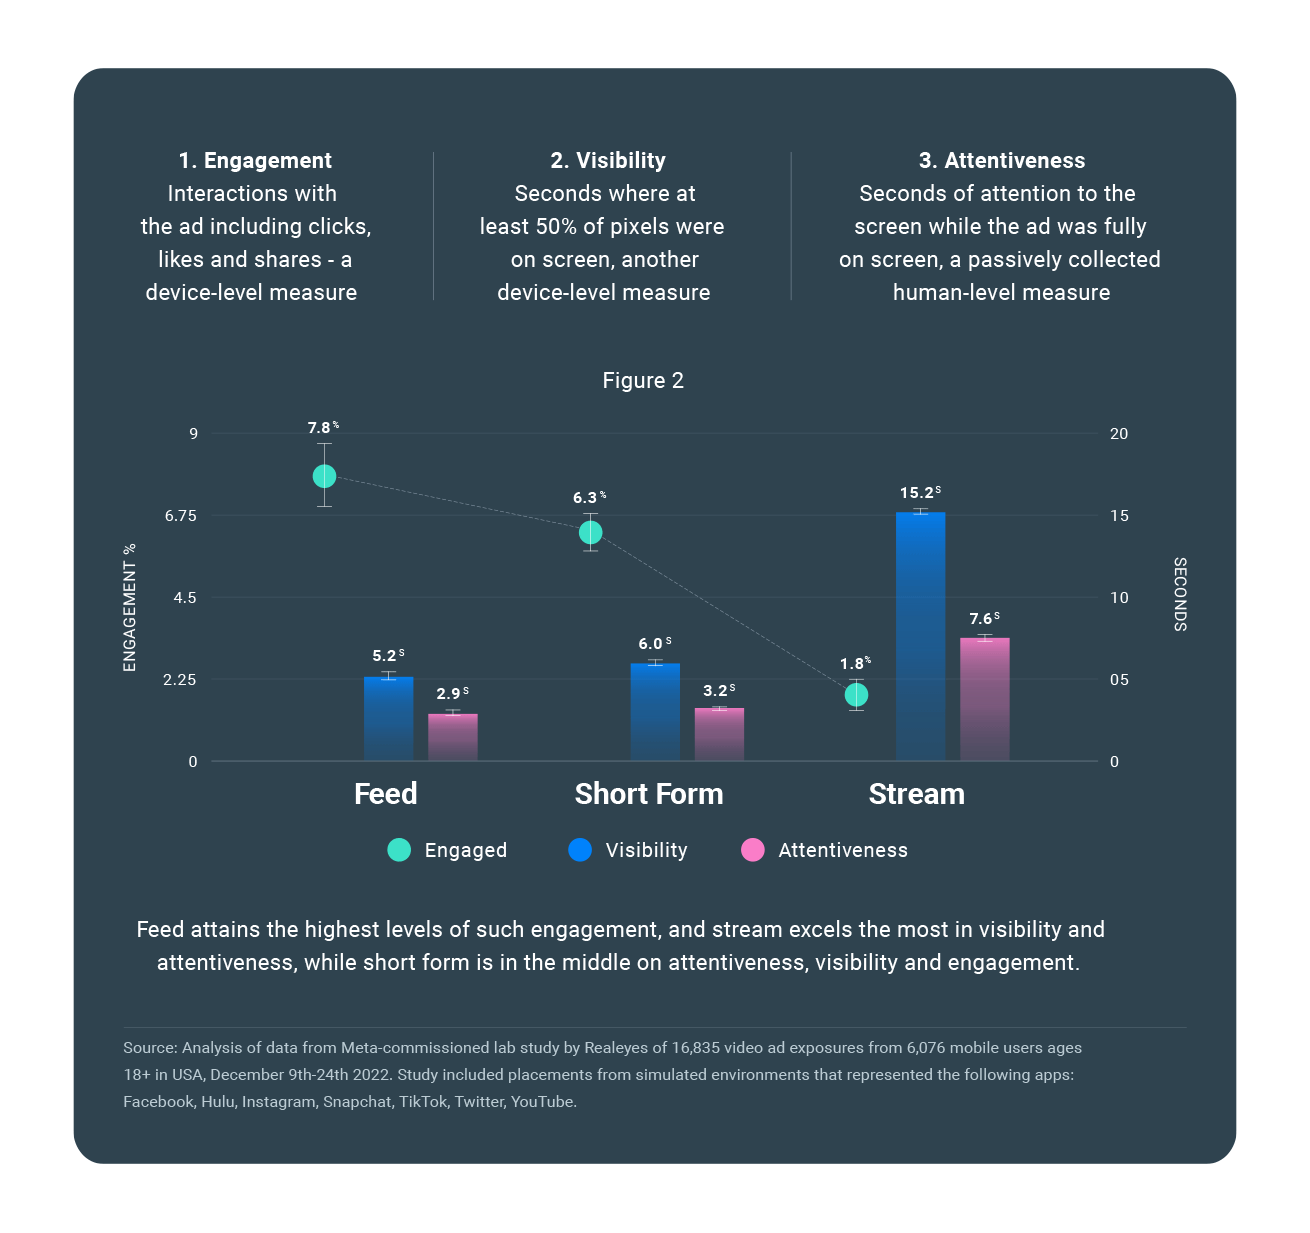
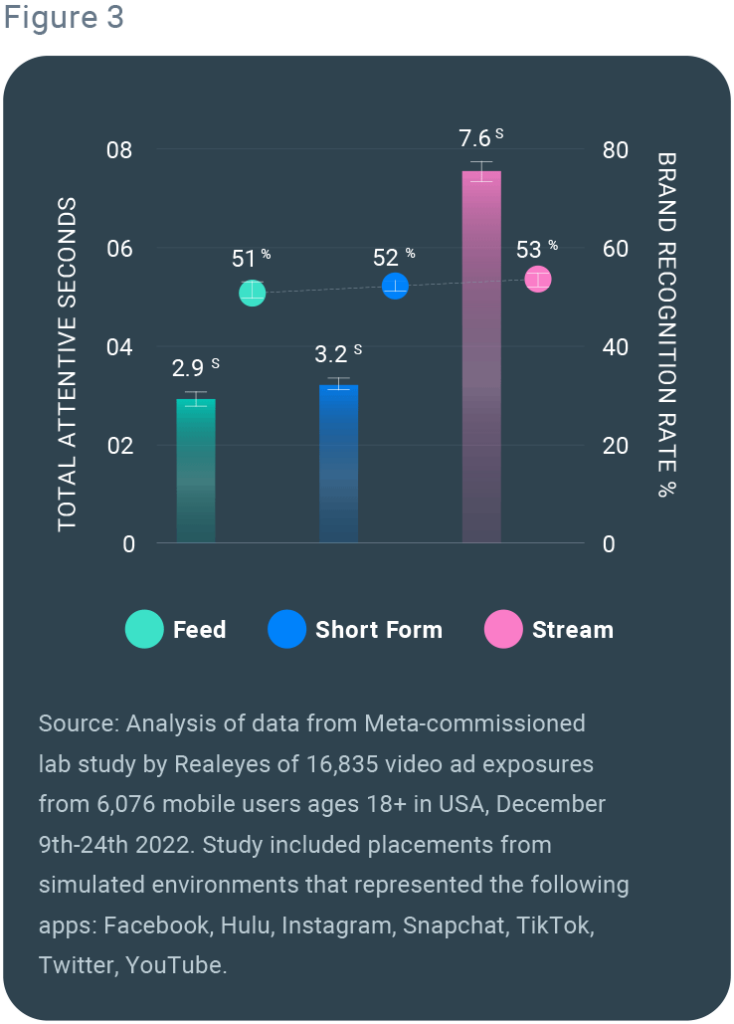
The study found that each digital environment also has its own characteristic behaviors. Feed attains the highest levels of engagement, and stream excels the most in visibility and attentiveness, while short form sees an intermediate level of attentiveness , visibility and engagement.
The total amount of
eyes on screen matters less than what quality
of attention is spent at critical moments of the ad, which is influenced by environment effects too.
Despite those differences, there were no significant differences in brand recognition across the environments. Feed and short form both generate about 0.16-0.17 brand recallers per second of attention, whereas stream produces only about .07 brand recallers each second.
Neuroscience research has shown that ads seen in scrolling conditions require less time to generate recall than those seen in stationary conditions.
Given this, we suggest that the user is cognitively focused on paying concentrated attention in these environments to be able to scroll down and decide as quickly as possible, deciding again and again to reject/pass by items, until something strikes one’s fancy.
In that heightened state of concentration, fewer seconds of attention would be needed to decide whether or not an item is appealing. The total amount of eyes on screen matters less than what quality of attention is spent at critical moments of the ad, which is influenced by environment effects too.
Outlook
This study provides a strong blueprint for advertisers to maximize their advertising’s impact.
Reflect on mental models for the media landscape. Be aware of how media is categorized by your organization, and by systems or data your organization uses. Consider where these definitions work and where they cause blind spots.
Match creative to environment to best leverage each environment’s unique strengths. For feed and short form, take advantage of initial bursts of attention by introducing the brand in the first few seconds. For stream environments, leverage audio and video cues to hold attention during longer views.
Test and learn to understand the value of attention in each environment. Validate against outcomes including incremental sales lift. Consider using norms or benchmarks to understand if attention is high or low relative to the same placements and audiences.
For feed and short form, take advantage of initial bursts of attention by introducing the brand in the first few seconds. For stream environments, leverage audio and video cues to hold attention during longer views.
Methodology
6,076 participants viewed video ads on mobile browsers generating 16,835 ad impressions. We partnered with five brands in tech, financial and CPG verticals who provided ads to test. We wanted to hold creative and audience as constant as possible so we can look at the effect of different environments – since we do know that creative and audience affect all the metrics we’re looking at.
Participants accessed the simulation through the browser in their mobile. The study set out to measure natural exposure as participants were simply asked to interact with the simulated app for two minutes, on their own smartphone in their own homes or wherever they liked.
Data was collected on a suite of ad metrics including engagement (interactions with the ad including clicks, likes shares, etc.), visibility (seconds where at least 50% of pixels were on screen), visual attention (seconds of attention to the screen while the ad was fully on screen) and facial reaction (measured through facial coding software). Participants also answered pre-task survey questions on demographics and mindset, and post-task survey questions on brand and ad metrics. Participants who had never used a particular platform before were excluded from analysis.
Participants were randomized to a platform-placement test cell – creating a huge split test across placements. First, they completed a survey about platform usage, then spent 120 seconds interacting with a simulated media environment. After the task, they were asked standard brand polling questions.